
| Configure Dataset Window | |
In this window you specify the properties of each dataset in the workbook. This window appears when you import a raw data file or when you choose from the menu.
This window displays the properties of the dataset using five tabs:
On this first tab you can enter a name and a nickname for the dataset. The name must be unique in the workbook, meaning two datasets in the same workbook cannot have the same name. The nickname should be a concise form of the name because Windographer uses it to identify and distinguish datasets.
You can also enter the dataset type, a color that Windographer can use to identify the dataset, and an optional description.
Enter the latitude, longitude, and elevation of the dataset so that Windographer can accurately calculate such variables as solar time, sunrise and sunset, clear-sky radiation, and so on. Also enter the dataset's time zone. Note that each dataset in the workbook can have a separate time zone. Windographer adjusts for the effect of the time zone whenever necessary.
This section describes the period of record and the length of time step. When importing a raw data file, it also displays the time stamp meaning, by which you can help Windographer interpret the file accurately.
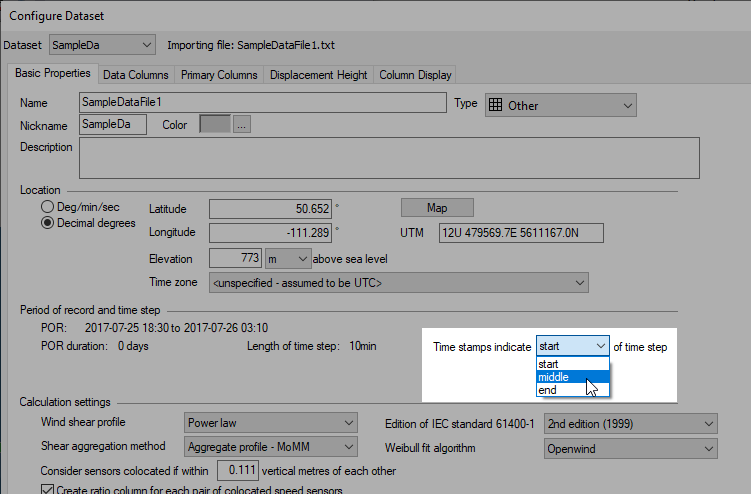
Tip: The time stamp meaning setting does not appear when you return to the Configure Dataset window after importing data, as the article on time stamp meaning explains. If you incorrectly set the time stamp meaning and you need to correct it after the import process, you can use the Apply Time Shift window.
The wind shear profile setting determines whether you see surface roughness values or power law exponent values in graphs and tables that report wind shear. You will see surface roughness if logarithmic law, or the power law exponent if you choose the power law.
The shear aggregation method determines how Windographer calculates the mean speed shear (and mean speed SD shear) over multiple time steps.
The edition of IEC standard 61400-1 setting determines whether Windographer reports representative turbulence values (prescribed by the 3rd edition of the standard) or the older characteristic turbulence values (prescribed by the 2nd edition).
The Weibull fit algorithm determines how Windographer calculate Weibull parameters.
Windographer gives special consideration to colocated sensors, which are sensors of the same type whose measurement heights are the same or nearly the same. With the edit box labeled Consider sensor colocated if... you can enter the colocation threshold, which is the measurement height margin within which Windographer considers sensors to be colocated.
Windographer will automatically create a column that is the ratio of same-height wind speed sensors if you choose with the Create ratio column for each pair ... setting. Looking at the ratio can help to identify conditions in which one or the other is sensor is experiencing a problem.
You can set the default value for each of the calculation settings in .
The Calm threshold affects wind rose diagrams. When Windographer tallies the number of time steps that the wind direction falls within some direction sector, it counts only those time steps in which the associated wind speed column (if any) reports a wind speed at or above the calm threshold.
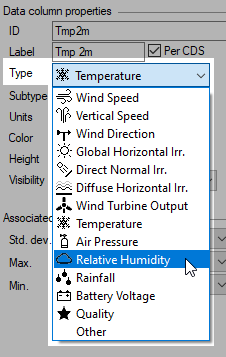
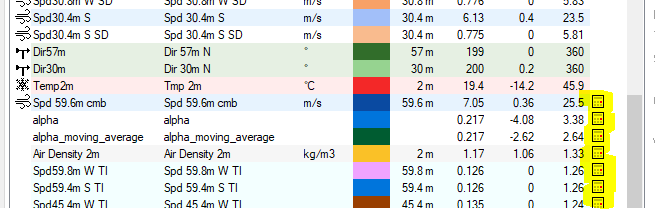
Use this tab to tell Windographer about the data columns in your dataset and to create and define new data columns. The data columns appear as items in the list. Click one to select a single data column. Use Shift-click or Ctrl-click to select multiple data columns and modify or delete several data columns at once.
After selecting one or more data columns, use the controls on the right side of the window to specify type, label, units, color, and measurement height. Windographer provides visual cues about these data column types and associations by including small icons and colored highlights in the data column list.
When you select a data column that you have not already associated with another, the Associated data columns section appears to let you specify any related data columns. From the Std. dev. drop-down box, choose which data column, if any, contains the related standard deviation data. You can also specify which data column, if any, contains the related maximum and minimum values, respectively.
Tip: Windographer uses these associated data columns to calculate quantities like turbulence intensity and extreme wind speeds. Your choices here also affect flagging: when you apply a flag to a mean data column, Windographer automatically applies it to the same time interval in the related SD, min, and max columns. Details appear in the article on associated data columns.
When you select a wind direction column, Windographer allows you to associate a wind speed sensor with that direction sensor. This selection affects vector mean direction calculations and wind frequency roses.
If you make data column invisible, it will not appear on the Time Series window or the lists of data columns that appear in such places as the Scatter Plot window and the Histogram window. If you wish to see a data column again, you can simply set it back to visible.
Click Add Column to add a calculated data column to your dataset. You can choose from several types of calculated columns. In the list of data columns, calculator icons appear beside calculated columns:
Select one or more data columns and click Copy Column(s) to add copies of those data columns to your dataset.
Select one or more data columns and click Delete Column(s) to remove them from the dataset. You can click Cancel to leave the configure dataset window without saving this deletion. Windographer also has a Delete Data window for more control over the deletion process.
Click Assign Colors if you want Windographer to assign a color to each data column automatically. (You can define the default color scheme in the Options window.) Windographer disables this button if the dataset already uses the default color scheme.
Click Save Template to export a file containing all the metadata about your dataset, including column names, types, units, colors, heights, and relationships between columns. Click Load Template to browse for such a file and apply it to the current dataset. In the Options window you can choose whether you want to include latitude, longitude, and elevation in the templates you save.
If you have selected a calculated data column, you can click Edit Definition, or simply double-click on the data column, to see and edit its definition. If you select one or more user-generated calculated data columns, you can click Convert to Static Column(s) to convert them into static columns so that you can flag scale them, for example.
On this tab you can choose the primary column of each type. You can select a particular data column by name, or specify a criterion such as the highest or lowest column, or the nearest column to a target height. Such criteria make use of the nearest-in-height rule.
Windographer uses the displacement height when calculating the wind shear. You might wish to specify a non-zero displacement height if you are measuring wind speeds in a forested area. You can specify the displacement height as a constant value, or varying by month or direction sector. If you specify by direction sector, you can indicate the direction sensor you wish to use to define the sector, and to specify a backup value for use in time steps containing no valid wind direction value.
If the displacement height varies by month or by sector, Windographer will automatically add to the dataset a calculated column containing displacement height in every time step.
This tab shows lets you choose from the available options for column display settings, make changes to particular settings, create your own, and set one as the default, which gets applied to all new datasets that you create. Click New or Edit to see the Column Display Settings window.
See also
Column Display Settings window