
| Column Display Settings | |
Column display settings (CDS) are a collection of settings that control the visibility, order, naming, and coloring of data columns. In the Configure Dataset window you can choose from a menu of CDS and customize the CDS to your liking.
You can customize the column display settings to reflect your company standards, and even create a library of different settings. You could use one set of CDS for met tower datasets and another for LiDAR datasets, for example, or different settings for different clients. The Column Display Settings tab of the Configure Dataset window lets you see and edit the library of column display settings, and set your preferred CDS. Each dataset that you create will receive your preferred CDS.
The Naming tab of the CDS window lets you impose a systematic naming convention for your data columns, so that your column names always follow a particular pattern regardless of what kind of data file they come from. The settings in the screenshot below, for example, specify that every data column should be assigned a label:

When applied to a LiDAR dataset, these settings result in the following column names:

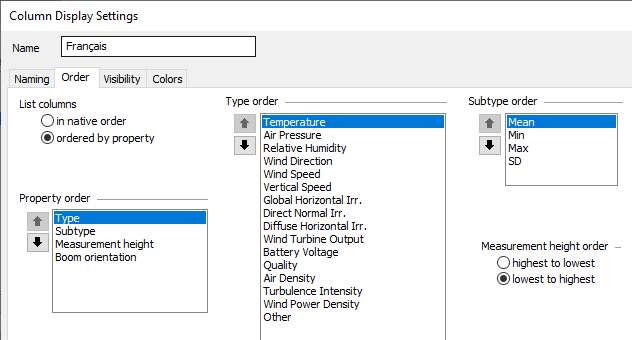
On the Order tab you can specify whether you want speed columns to appear before radiation columns, temperature columns, and so on, whether columns should be sorted first by type, then by height, or first by subtype, then boom orientation, and so on, and whether columns should be sorted highest to lowest, or lowest to highest.
The settings in the screenshot below say that temperature columns should come first, then air pressure, RH, direction, and so on, and that columns should be sorted lowest to highest:
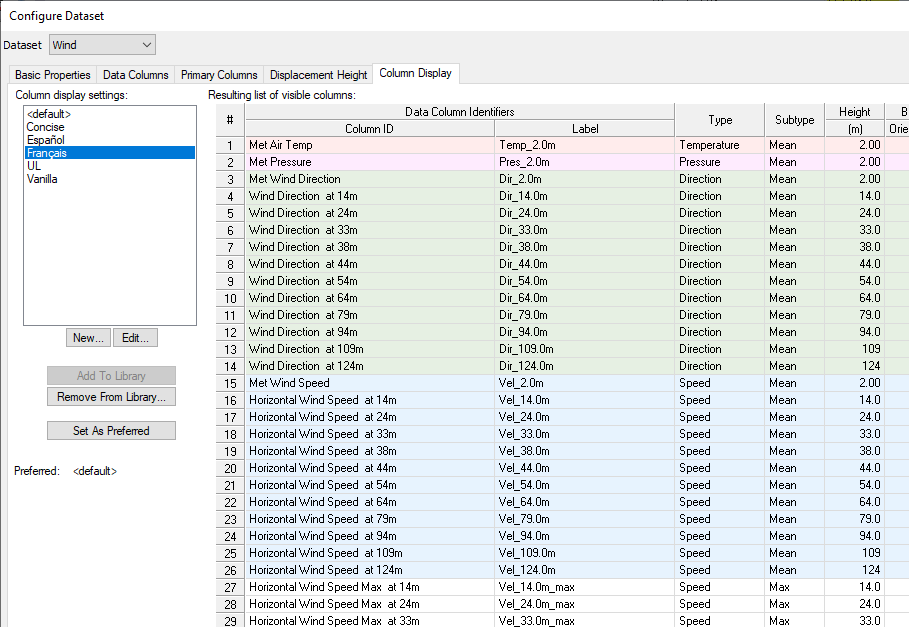
Those order settings cause the LiDAR data columns to appear in this order:
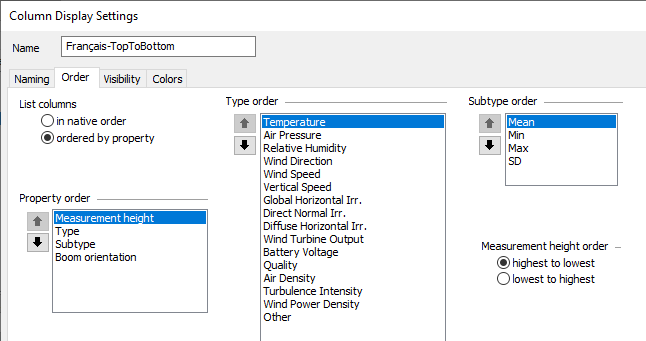
If instead you wish to see the data columns ordered by height, then type, you could use these settings:
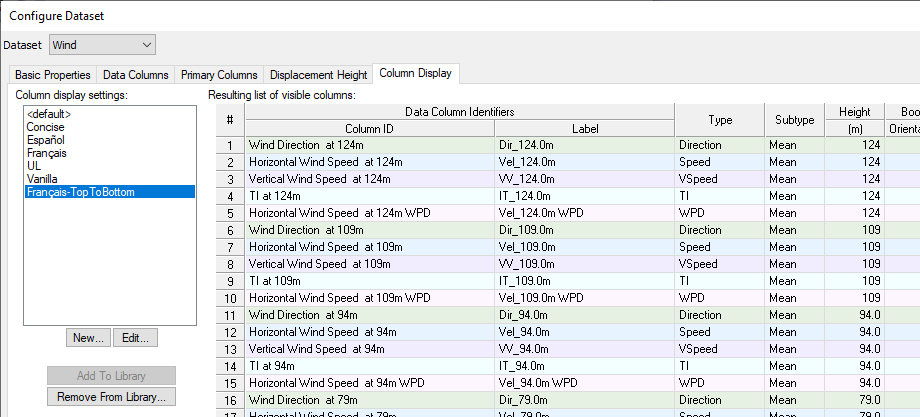
And the columns would appear in this order as a result:
You can hide any data column that you do not wish to see in lists of columns or in graphs. The CDS gives you the chance to hide all columns of particular types and subtypes. The settings below, for example, say to hide all data columns of type 'wind speed' and subtype 'minimum'. They also say to hide min. and max. columns of type vertical speed and direction, and standard deviation, min. and max. columns of type temperature:

On the Colors tab you can specify the color scheme you wish Windographer to apply to data columns, to help you distinguish column types and heights in graphs.
See also
Column Display Settings window