
| Tables Window | |
The Tables window produces the following tables. You'll see a different menu of tables depending on whether you have chosen a specific dataset from the dataset drop-down box, versus when you have chosen <all selected> datasets.
| Table | Contents |
|---|---|
| Workbook Summary | A summary of the key properties of each of the datasets you have selected in the Workbook Explorer. |
| Dataset Summary | A brief summary including the start and end date, the time step, the mean environmental conditions, and the wind shear parameters. |
| Data Channel Summary | A summary of all data channels, including calibration information and data recovery. Note that if the calibration changes over time, the final values are shown. |
| Data Columns | A statistical summary of each data column. |
| Calibration History | This table shows all of the data channels and their calibration. Any change in calibration, serial number or boom orientation is shown as an additional row of information. |
| Environmental Summary | The mean, minimum, and maximum values of the temperature, pressure, air density and energy-weighted air density. Note that if you have multiple temperature or pressure sensors, the uppermost sensor will be used. |
| Wind Speed Sensor Summary | A statistical summary of each wind speed data column. |
| Combined Wind Speed Sensor Summary | Any calculated column that combines two wind speed sensors, usually using the Revise > Combine Anemometers window, are summarized. This includes the data recovery rate (DRR) and mean of the original columns as well as the new column. |
| Daily Statistics | The mean, median, minimum, maximum, and standard deviation of a data column for a calendar period. For wind speed columns, Weibull variables are also provided. For wind direction columns, both vector and scalar means are provided. |
| Monthly Statistics | |
| Quarterly Statistics | |
| Annual Statistics | |
| Directional Statistics | The mean, median, minimum, maximum, and standard deviation of a data column in each wind direction sector. Note that these and other statistics by direction bin can be calculated on the Wind Rose window, and viewed in graphical or tabular form. |
| by Month and Hour of Day |
Statistics of a data column in each month of the year and each hour of the day.
Five separate tables are provided: Occurences Mean Minimum Maximum Standard Deivation |
| by Day of Year and Hour of Day |
Statistics of a data column for each day of the year and each hour of the day. For a large dataset this will be a 366 x 24 table.
Five separate tables are provided: Occurences Mean Minimum Maximum Standard Deivation |
| by Hour of Year |
Statistics of a data column for each hour of the year.
Five separate tables are provided: Occurences Mean Minimum Maximum Standard Deivation |
| by Year and Month |
Statistics of a data column in each year and month.
Five separate tables are provided: Occurences Mean Minimum Maximum Standard Deivation |
| by Month | Statistics of all data columns by month. Five separate tables are provided: Occurences Mean Minimum Maximum Standard Deivation |
| Statistics by Bin | The statistical characteristics of one data column versus bins defined by a second data column. |
| Weibull Statistics by Month | The monthly Weibull parameters of every visible wind speed data column. |
| Mean of Monthly Means | The mean of monthly means of a particular data column, showing intermediate calculations. |
| Wind Speed Statistics for Synthesis | The statistical characteristics of one data column for use in the Synthesize Wind Speed Data Tool. |
For any table that involves bins, Windographer will automatically choose a reasonable bin size and a start point for the first bin, but you can override these settings if you wish. Note that only visible data columns can appear in these tables.
The Filter by section allows you to filter for a subset of your data. For more information see the article on filtering data.
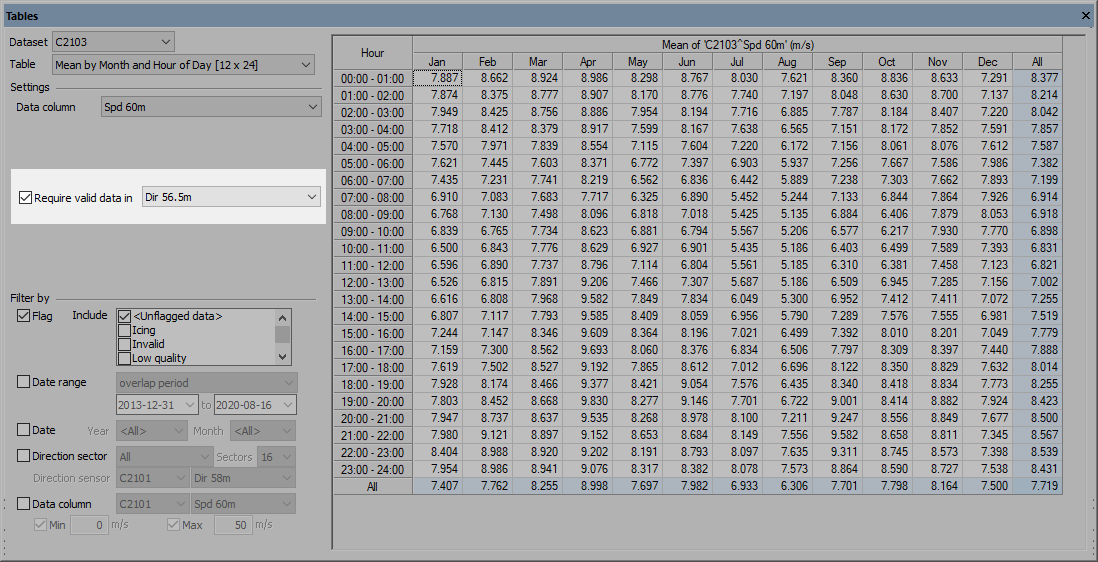
For most tables, you have the option to confine the analysis only to those time steps that contain valid data in an additional data column. In other words, it is an option to require concurrency with another data column. For example, in the screenshot below the user has displayed the mean value of the 'Spd 60m' data column by month and hour, while requiring valid data in the 'Dir 56.5m' data column. That requirement makes Windographer exclude from this analysis any time step in which the 'Dir 56.5m' value is either missing or flagged to exclude:
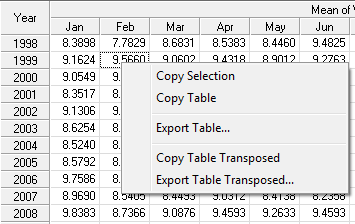
Right click any table to export it to a text file or to copy it to the clipboard. You can also export the table by clicking the Export Table button on the left side of the Tables window.
See also