| Statistics by Year and Month Tables |  |
Five closely-related tables make up the 'Statistics by Year and Month' family of tables. In each of the five tables, Windographer shows a statistical measure of one data column for each month of the year and each year of the dataset. The five statistical measures corresponding to the five tables are: number of occurrences, mean, minimum, maximum, and standard deviation. A cell appears blank if the selected data column contains no data that meet your filter criteria for that year and month.
You can create these tables on the Tables window of Windographer's main window. You can create a graph of the mean monthly or mean annual values on the Time Series window.
You can create a table for a specific subset of the data using the Filter by section. For more information see the article on filtering data.
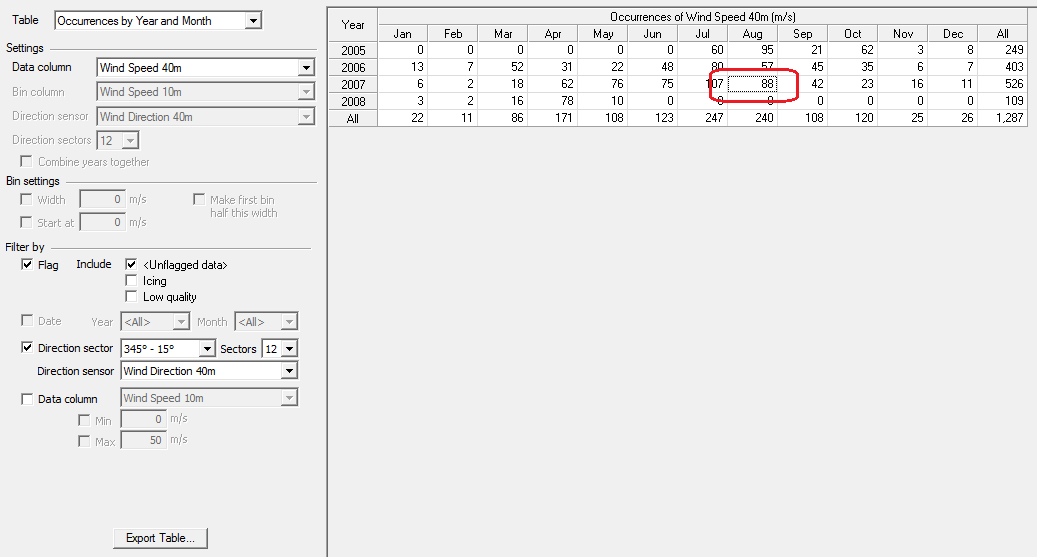
In the occurrences table below, the highlighted cell indicates that in August 2007, Windographer found a total of 88 time steps in which the 'Wind Speed 40m' data column was not flagged as 'Icing' or 'Low Quality', and the 'Wind Direction 40m' data column reported a value in the range of 345° - 15°

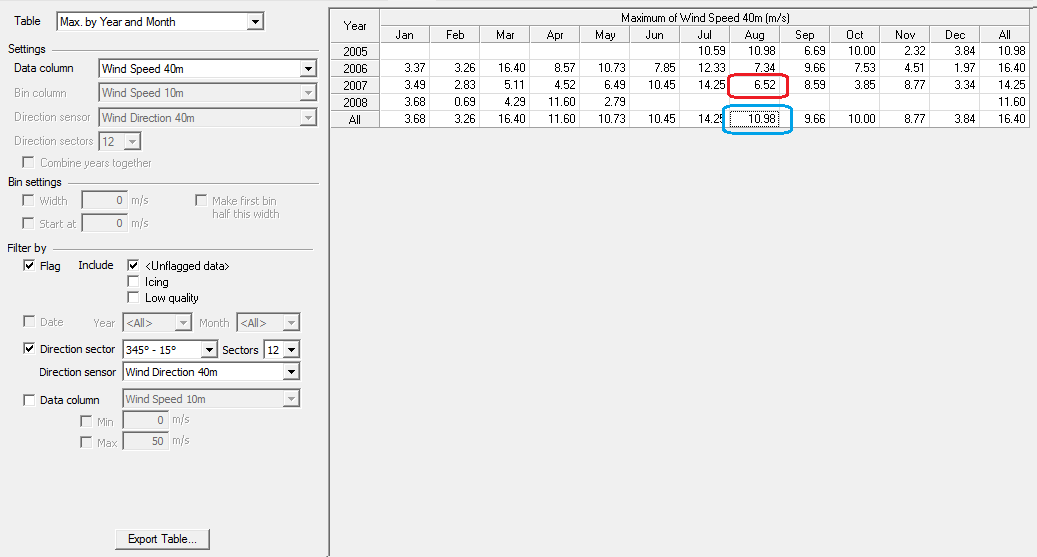
In the maximum table below, the red highlighted cell indicates that in August 2007, under the same filter settings as the previous example, the maximum value of the 'Wind Speed 40m' data column was 6.52 m/s:

Note that the in the table above, the values in the All column are the maxima of the values appearing in the column to the left. Similarly, the values in the All row are the maxima of the values in the columns above them. The blue highlighted cell indicates that the highest value reported by the 'Wind Speed 40m' data column in any August was 10.98 m/s.
The other varieties of this type of table report mean, minimum, and standard deviation per month and hour of day.
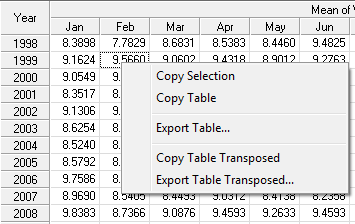
Right click on a table and choose to export it to a text file. Windographer will prompt you to supply the file name and location. You can also copy it to the clipboard:

See also
Statistics by Month and Hour of Day table