
| Statistics by Month and Hour of Day Tables | |
Five closely-related tables make up the 'Statistics by Month and Hour of Day' family of tables. In each of the five tables, Windographer shows a statistical measure of one data column for each hour of the day and each month of the year. The five statistical measures corresponding to the five tables are: number of occurrences, mean, minimum, maximum, and standard deviation. A cell appears blank if the selected data column contains no data that meet your filter criteria for that month and hour of day.
You can create these tables on the Tables window of Windographer's main window. You can create a graph of the mean monthly or mean annual values on the Time Series window. You can graph the mean hourly values by month on the Diurnal Profile tab.
Use the controls in the Filter by section of the window to focus on a particular subset of you data. For more information see the article on filtering data.
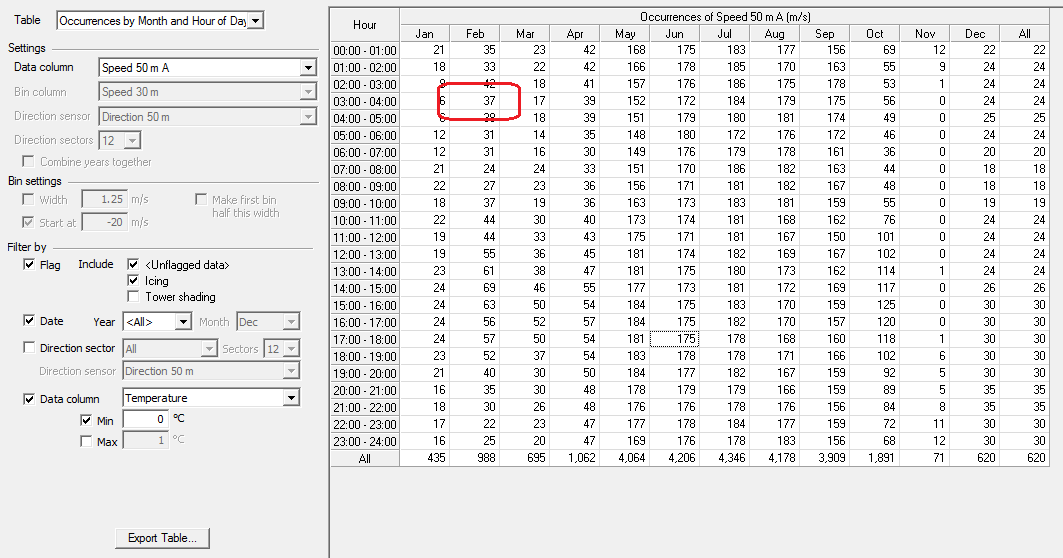
In the sample occurrences table below, the highlighted cell indicates that in February, between the hours of 03:00 and 04:00, a total of 37 time steps report valid values of the 'Speed 50m A' data column (including those flagged as 'Icing') in which the 'Temperature' data column is greater than or equal to 0°.
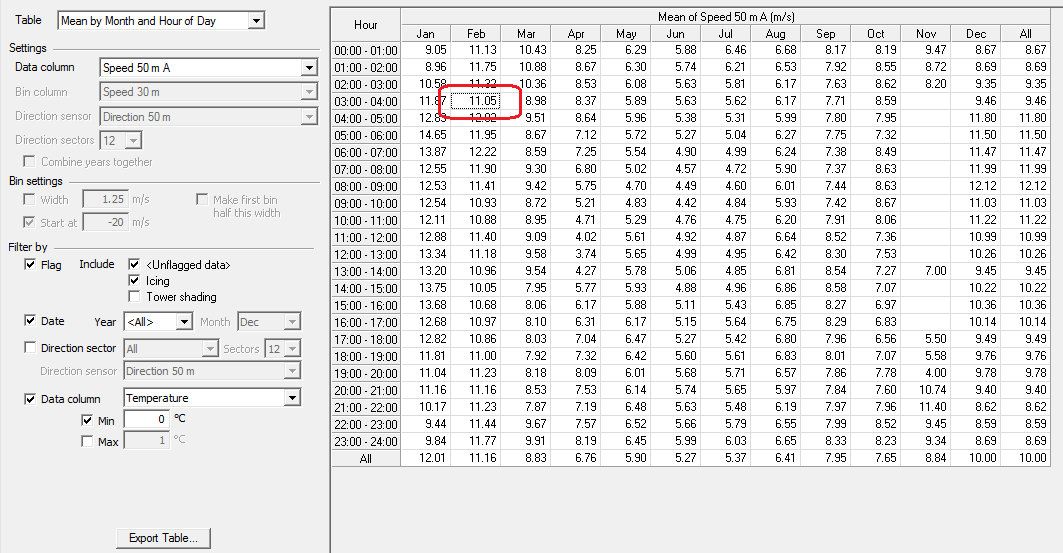
In the mean table below, the highlighted cell indicates that the 'Speed 50m A' data column averages 11.05 m/s (including data flagged 'Icing') during February between 03:00 and 04:00 when the 'Temperature' data column is greater than or equal to 0°:
The other varieties of this table work the same way and report the minimum, maximum, and standard deviation in each month and hour.
Note that Windographer calculates these statistics from the data column you select, and not from any associated data column. Any value that the minimum-by-month-and-hour-of-day table reports, for instance, is the minimum value reported in some particular bin by that data column, not by its associated minimum data column.
Right click on a table and choose to export it to a text file. Windographer will prompt you to supply the file name and location. You can also copy it to the clipboard and transpose it.
See also
Statistics by Year and Month table