
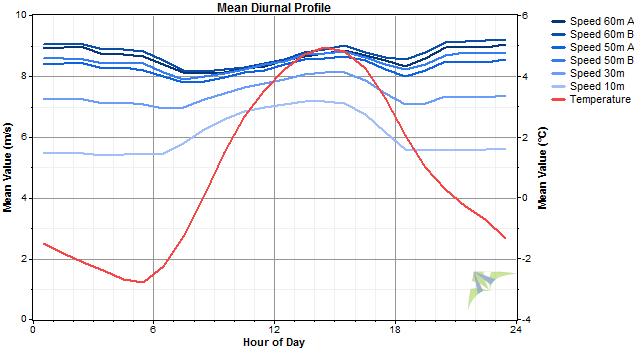
| Diurnal Profile Window | |
The Diurnal Profile window displays the average diurnal profile of one or more data columns. Use the list of checkboxes to select which data columns to display. Windographer will allow you to display columns with two different units (e.g. wind speeds in m/s and temperatures in °C) but will then disable columns with other units.
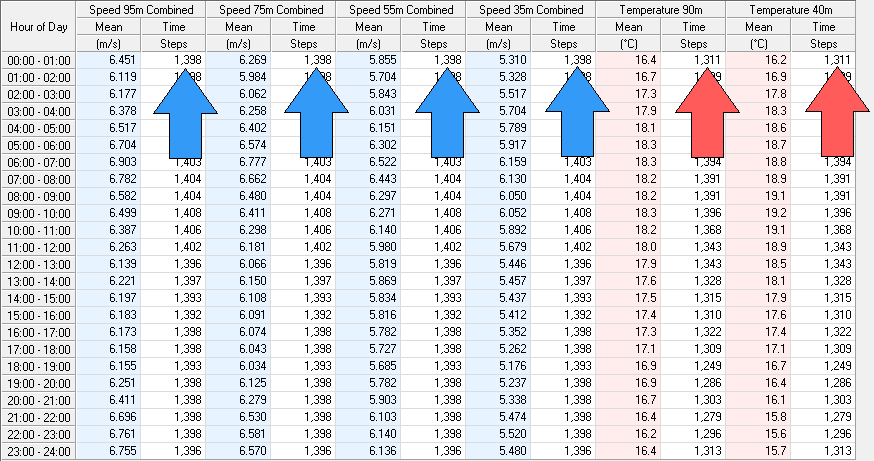
Use the Format buttons to see the results in graphical or tabular form. The table also includes the number of time steps used in each hourly bin.
You can see a diurnal profile graph and corresponding table for each month of the year by choosing by month. More tables by month and hour of day are available on the Tables window.
To calculate the average daily profile of a set of data points, Windographer finds the average value of all of the points that occur within the hour of 12:00am to 1:00am, then all those that occur within the hour of 1:00am to 2:00am, and so on for each of the 24 hours of the day.
If some of your data columns contain missing data segments or segments flagged to exclude, you can compare their diurnal profiles more accurately by using the Require concurrency filter setting.

For example, if one of wind speed sensors was not working for much of the winter, it would show a distinctly summer-like profile that might differ strongly from the other sensors unless you chose to use only those time steps containing data for all sensors.
Note that this requirement for all time steps to contain data applies separately to each data type. For example, consider a case where you check this checkbox while displaying four speed sensors and two temperature sensors as in the screenshot below. In each hour the four mean speed values will be based on the set of time steps that contain valid values for all four speed sensors (blue arrows), while the two mean temperature values will be based the set of time steps that contain valid values for both temperature sensors (red arrows). In this example the mean speeds are calculated from a different set of time steps than the temperature means, which is typical since the patterns of gaps and flags usually differs from one data column to another.
The diurnal profile of the all wind speeds also appear in the Summary Report on the Reports window.
The Filter by section allows you to create a diurnal profile for a subset of your data. For more information see the article on filtering data.
Right-click any graph to change its properties, copy the image to the clipboard, or export it to a file. Right-click on any table to export it to a file, or copy it. See the article on exporting graphs or exporting tables for more information.
See also