
| Reports Window | |
The Reports window allows you create standardized reports from your datasets. Reports are saved as .doc files, suitable for review and editing in work processing software such as MS Word.
First, select the Dataset to report on. Then, select the Report you want to create.
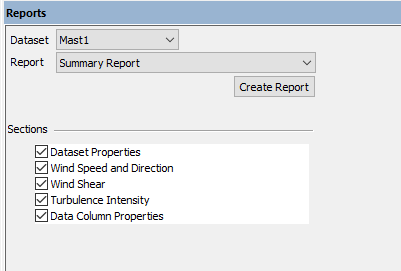
Once you have chosen a report, and which sections you wish to include and any applicable settings, click the Create Report button to generate the report. You will be asked to specify where to save the file.
The Summary Report displays the statistical characteristics of the dataset that wind energy analysts typically consider most important.
| Section | Contents |
|---|---|
| Dataset Properties | This section of the report provides an overview of the dataset. The information shown in the properties table also appears in the Dataset Summary table in the Tables window. The monthly statistics for the primary temperature sensor appear as a boxplot. This graph can also be created from the Boxplot window. |
| Wind Speed and Direction | This section of the report includes six graphs: two graphs from the Summary tab with wind speed information by month and time of day; a wind speed histogram (which displays data from the primary wind speed sensor) from the Histogram window; and thee wind roses from the Wind Rose window. Please refer to the articles on those windows for further information about any particular graph. |
| Wind Shear | This section of the report displays four graphs from the Wind Shear window In these graphs, Windographer displays either the power law exponent or the surface roughness, depending on the preference you have specified in the Options window. |
| Turbulence Intensity | This section of the report includes four graphs from the Turbulence window. Each graph displays data from the primary wind speed sensor. The graphs display either the characteristic turbulence intensity or the representative turbulence intensity, depending on which IEC standard you have chosen as your preference on the Options window. |
| Data Column Properties | This section of the report contains a table showing the label, units, and measurement height of each data column, as well as the number of records and some basic statistics (mean, minimum, maximum, standard deviation). This table also appears on the Tables window as the Data Columns table. |
The Extended Summary Report can include all of the items from the summary report plus four addition sections. Addition sections are described in detail below.
| Section | Contents |
|---|---|
| Dataset Properties | (From summary report) |
| Wind Speed and Direction | (From summary report) |
| Wind Shear | (From summary report) |
| Turbulence Intensity | (From summary report) |
| Environmental Summary | This section of the report contains a short table showing statistics about the air temperature, air pressure and calculated air density of the data. If you have multiple temperature or pressure sensors, the uppermost sensor will be used. If your dataset does not contain temperature or pressure data, that line will be blank. This table also appears on the Tables window as the Environmental table. |
| Wind Speed Sensor Summary | This section of the report contains a table showing detailed statistical information about each of the wind speed sensors. This table also appears on the Tables window as the Wind Speed Sensor Summary. |
| Flag Statistics | This section of the report contains a table showing the number of flagged time steps in each data column for each flag. This table ignores any flag filtering. This table also appears on the Tables window as Flag Statistics. |
| Data Coverage | This section of the report shows a data coverage chart with the location of gaps in each data column of the dataset. This graph also appears on the Data Coverage window. |
| Data Column Properties | (From summary report) |
The Monthly Report displays detailed data for any calendar month that the dataset covers. In the Settings section, choose the month using the Year and Month drop-down boxes. If you choose a month with no data, this report will be empty.
| Section | Contents |
|---|---|
| Report Settings | This section of the report shows the name of the month covered and the time the report was generated. |
| Wind Speed Data | This graph shows the wind speed through the specified month for all wind speed sensors. |
| Wind Direction Data | This graph shows the wind direction through the specified month for all wind direction sensors. |
| Temperature Data | This graph shows the temperature through the specified month. If you have multiple temperature sensor, this graph will display the uppermost sensor. |
You can create each of these time series graphs on the Time Series window.
The Monthly Met Tower Report displays detailed data for any calendar month that the dataset covers. In the Settings section, choose the month using the Year and Month drop-down boxes. If you choose a month with no data, this report will be empty.
| Section | Contents |
|---|---|
| Project Characteristics | This section of the report shows filter settings including selected month, details of all datasets in the workbook and additional summary details about the selected dataset. |
| Wind Resource 1 | Time series graph of all speed, direction and temperature columns. |
| Wind Resource 2 | Wind speed dirunal profile (all speeds), vertical shear profile and speed frequency histogram (primary). |
| Wind Resource 2 | Wind frequency and energy rose for primary speed column. |
| Sensor Summary | Table of basic data from all speed, direction and temperature columns. |
The Data Column Report displayed detailed graphs and statistics for a single data column. In the Settings section, choose Data column to display.
| Section | Contents |
|---|---|
| Report Settings | This section of the report shows the name of the name of the selected data column, the filter settings, and the time the report was generated | Monthly Statistics | This section of the report contains a table showing the data recovery rate, mean, median, minimum, maximum, and standard deviation of a data column for each month of the dataset. For wind speed data columns, it also shows the best-fit Weibull l parameter. This table also appears on the Tables window as the Monthly Statistics table. |
| Monthly Flag Statistics | This section of the report contains a table showing the number of flagged time steps for each flag for each month of the dataset. This table ignores any flag filtering. This table also appears on the Tables window as Monthly Flag Statistics. | Annual Statistics | This section of the report contains a table showing the data recovery rate, mean, median, minimum, maximum, and standard deviation of a data column for each year of the dataset. For wind speed data columns, it also shows the best-fit Weibull l parameter. This table also appears on the Tables window as the Annual Statistics table. |
| Annual Flag Statistics | This section of the report contains a table showing the number of flagged time steps for each flag for each year of the dataset. This table ignores any flag filtering. This table also appears on the Tables window as Annual Flag Statistics. |
| Additional Graphs | This section of the report shows a probability density function graph, a monthly statistics box plot and a cumulative distribution function graph for the selected data column. |
You can change the title of the report by modifying the Name (not the nickname) in the Configure Dataset window.
Many of the graphs shown in the reports use the colors that you specify in the Configure Dataset window. The wind roses appear with the default style number of sectors, which you can specify in the Options window.
Only data columns marked as Visible in the Configure Dataset window will be included in the report.
Some graphs may appear blank if the dataset does not contain the required information. For instance, if the dataset contains no wind direction sensor, the wind roses will be blank.
In general, you can create a report for a subset of the data using the Filter by section. The filter settings will appear at the top of the Dataset Properties section of the Summary Report. For more information see the article on filtering data.
You can create an annual report for using the Filter by Date and choosing a single calendar year, or by selecting a single year with the Date Range filter.
If Windographer cannot locate the report definition file on your computer, the Report drop-down box will offer only Report definition file missing. In that case, please contact Windographer support for assistance in restoring the report functionality.
See also