
| Annual Flag Statistics Table | |
This table shows, for the data column you select and for each year in the dataset, the number of data points flagged with each flag.
You can create this table in the Inspect and Remove Flags window. It also appears in the Data Column Report, which you can create on the Reports tab of Windographer's main window.
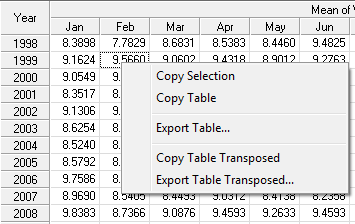
Right click on this or any other table to export it to a text file or to copy it to the clipboard:
See also
Inspect and Remove Flags window