
| Inspect and Remove Flags Window | |
The Inspect and Remove Flags Window lets you examine, filter and sort the flagged data segments in your file, in order to analyze or remove them. To access this window, choose from the menu.
In the top left corner of the window, select the flags and data columns that interest you. Windographer will report the number of data segments in those data columns flagged with those flags. In the example below, the user has searched data columns 'Speed 60m A SD' and 'Speed 60m B SD' for data segments flagged with the 'Icing' or 'Low quality' flags. Windographer reports that two segments meet this criteria. Clicking Unflag These Segments will remove the flags from those data segments. (It will not affect the actual numerical data values within those segments, it will simply unflag them.)
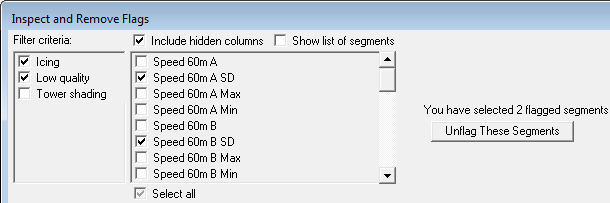
Check Include hidden columns to display even columns not set as visible in the Configure Dataset window. Otherwise these columns will not be shown here, nor will any flagged data or segments on those columns be included in statistics or tables in this window.
Calculated columns are not included in this list because they cannot be flagged in Windographer.
Check Show list of segments to display the entire list of these flagged segments. You can sort this list by flag, data column, start time, end time, or length by clicking on a column heading. When you click on one of the flagged segments in this list, Windographer will highlight the relevant time interval in the time series graph below.

Tip: Use Shift-Click or Ctrl-Click to select more than one flagged segment.
Click Unflag Selected Segments to remove the flag from each of the segments you have selected in the list, or click Unflag All Segments In List to unflag every segment in the list.
When you flag or unflag a data column, Windographer automatically flags or unflags its associated data columns as well.
The bottom portion of the window displays a time series graph or a table of flag statistics so you can visualize and analyze the flags applied in your dataset.
Note that your filter selections in the top portion of the window do not affect this lower portion of the window. But if you unflag any segments in the top portion of the window, the bottom portion of the window will update accordingly.
Note that the time series graph will only display columns set as visible, but the tables can include the hidden columns as well, depending on the selection of the Include hidden columns box.
The following tables display statistics about the flag status of your dataset:
| Table | Contents |
|---|---|
| Overall Flag Statistics | The number of flagged time steps in each data column for each flag. |
| Monthly Flag Statistics | The number of data points flagged by each flag in each month, for the selected data column. |
| Annual Flag Statistics | The number of data points flagged by each flag in each year, for the selected data column. |
See also