
| Flagging Data | |
Windographer's flagging capability gives you a powerful mechanism for highlighting, classifying, and filtering your data. You can define any number of your own flags, apply them to any number of data segments either manually or automatically, and then use those flags as criteria to include or exclude data from virtually any of Windographer's calculations, graphs, and export files.
A flag is simply a category, defined by a name and a color. Windographer provides multiple ways to apply flags to data segments. When you apply a flag to a data segment, you are categorizing that data segment. If you apply the 'Icing' flag to a data segment, for example, you are identifying that data segment as having been affected by icing. What you do about that categorization is a separate issue, one that you can decide later. You might, for example, choose to exclude from calculations any data flagged with the 'Icing' flag, but to include data flagged with the 'Tower Shading' flag. Or you might want to color code the points in a scatter plot according to flag. Or you might simply want to see a table showing the number of data points in each data column that were flagged with each flag.
The process of flagging a data segment does no harm to the data itself, and is entirely reversible. Flagged data points remain visible in time series graphs unless you specify otherwise in the properties of the flag. The example below that shows where the user has applied the 'Icing' flag to a 60-hour segment of the 'Speed 45m' data column:
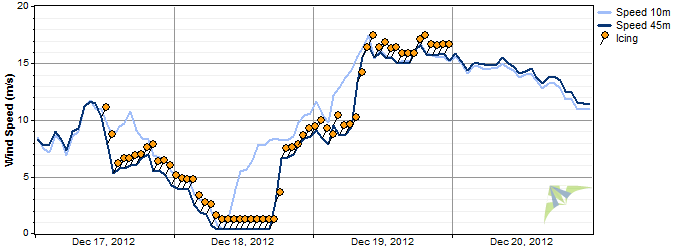
So flagging a data segment does not remove or harm that data segment, it simply marks it as belonging to a particular category. But this categorization of data enables many powerful capabilities, the most important of which is the ability to filter by flag.
This article briefly describes the main concepts related to the flagging of data in Windographer, and links to more detailed articles.
By default, Windographer includes a list of several flags, one for icing, one for tower shading, one for low quality data, one for invalid data, and so on. So you need not create or modify any flags unless you choose to do so. You can manage your list of flags in the Define Flags window. You can even build a list of your favorite flags. Windographer will make these flags available in every dataset that you create in Windographer.
Most flags will have a negative connotation indicating some kind of problem in the dataset, such as tower shading, icing, low signal-to-noise ratio, or sensor malfunction. You would probably choose to exclude from calculations any data flagged with that type of flag. But a flag could instead have a positive or neutral connotation. For example, Windographer flags any artificial data it generates to fill gaps or when extrapolating up to hub height. That 'synthetic' flag has a neutral connotation, but the fact that it gets applied to synthetic data makes it possible for you to recognize, highlight, filter, or remove that synthetic data at a later date.
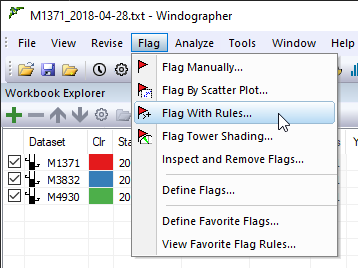
You can apply flags either manually by clicking and dragging on a time series graph, or automatically by executing flag rules. You can use these two methods in any combination and in any order. To perform quality control on a dataset, for example, you could start by executing your favorite set of flag rules that might catch 80% of the problems in the dataset in a few seconds. Then later when you have sufficient time, you could systematically step through the dataset, visually reviewing and manually adjusting the work done by the flag rules. You may, for example, flag problem segments that the flag rules missed, or remove flags from segments that they incorrectly caught. Alternatively, you might choose to rely entirely on manual flagging, or you might refine your flag rules to the point that you rely on them exclusively.
The menu contains four windows that let you apply flags:
When you flag data segments, Windographer stores those flagged segments in the dataset. So the next time you open the workbook containing that dataset, the flagged segments will remain visible. If you send the document to a colleague who opens it in Windographer, the colleague will also be able to see the data segments you have flagged.
Whenever you apply a flag, whether manually or with a flag rule, to a segment of a data column, Windographer automatically applies the same flag to the same time interval of its associated data columns. So if you flag a six-hour period of a wind direction column, for example, Windographer will also flag the same six-hour period in the associated standard deviation, minimum, and maximum columns, assuming you have specified those associated data columns in the Configure Dataset window.
Windographer also automatically flags segments in pre-defined calculated data columns. If you apply a flag to a three-hour period of a wind speed standard deviation data column, for example, Windographer will apply the same flag to the same three-hour period of the turbulence intensity column that it calculates from that standard deviation column.
You cannot apply flags to any calculated data column, whether pre-defined (like air density or turbulence intensity) or user-defined. Windographer considers the flag status of the underlying data columns when generating such calculated data columns, and it will automatically regenerate them any time you flag or change the underlying data columns in any way.
Tip: Windographer keeps a complete record of the steps you take when applying flags to a dataset, among other changes you make to the dataset. This record appears in the Dataset History window.
You can remove flagged segments in the Inspect and Remove Flags window. You can also remove flags manually in the Flag Manually.
When you delete a flag from the dataset using the Define Flags window, Windographer will remove any flagged segment that uses that flag. It will warn you first, to give you a chance to change your mind about deleting that flag.
Note that removing a flagged segment does not delete the data segment itself; it simply removes the flag from that data segment. Use the Delete Data window if you want to delete data.
The main reason to flag data segments is to enable you to filter them out of calculations and export files. Windographer makes this easy by presenting a list of checkboxes that correspond to the flags you have applied in the dataset. An example appears below:

To include data segments flagged with the 'Icing' flag, you simply check the checkbox labeled 'Icing'. Otherwise, you do not check that checkbox. This list of checkboxes appears in almost every window of Windographer, from the Wind Rose window to the Reports tab to the Turbulence window to the Export Data window. In each case, the window will react immediately as you check or uncheck these checkboxes, updating the graph, table, or export file preview to reflect your new filter settings. So you can very quickly see the effect of including or excluding the different categories of data.
See the article on filtering data for a more complete description of this capability.
See also
Inspect and Remove Flags window