
| Flag Manually Window | |
This window lets you flag and unflag data segments by clicking and dragging on a time series graph or in the associated table. To access this window, choose from the menu. By default, this window restores its state from the last time you closed it, meaning it will display the time interval and data columns that it was displaying when you last closed it. If you would prefer it to set its initial state to correspond to that of the Time Series window, you can choose that option in .
You can select data points to flag using the time series graph or the table, or both together. You can control the relative size of the graph and table sections by placing the cursor between the sections, clicking, and dragging up or down:
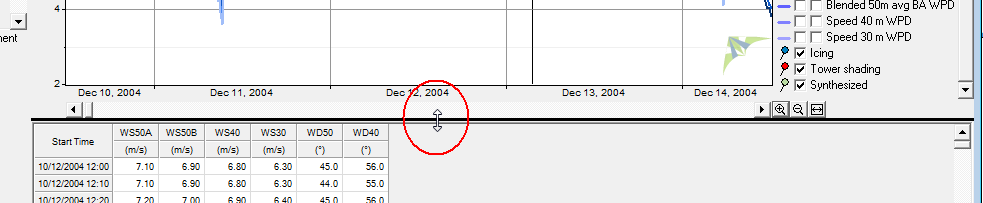
Use the scroll bar below the graph to move the graph forward or backward in time, and click the zoom buttons to the right of the scroll bar to zoom in or out. The third zoom button zooms out to display all the data:
You can also use the following shortcut keys to zoom and move the time series graph:
| Shortcut | Action |
|---|---|
| +/- keys | Zoom in/out |
| mouse wheel | Zoom in/out |
| Up/Down arrow keys | Zoom in/out |
| Right arrow key | Scroll right (forward in time) |
| Left arrow key | Scroll left (back in time) |
To apply a flag to a data segment, you must specify three things:
The same is true for removing a flag from a data segment.
You specify the time interval by by clicking and dragging on the graph or the table. To do so using the graph, click on one end of the time interval and drag the cursor to the other end. To do so using the table, click and drag to select a block of cells. The Start and End controls will display the selected time interval, and you can adjust it with their arrow buttons. The table automatically highlights the time interval that you select in the graph, and vice versa.
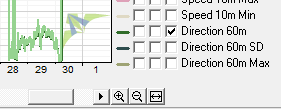
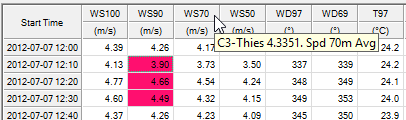
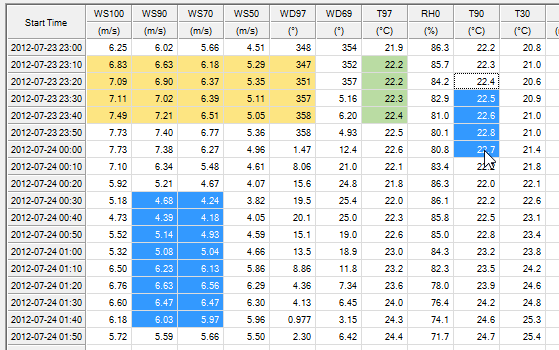
The table uses color to indicate the flag status of each data point. If a data point has been flagged with a green flag, then its cell will have a green background. Click Table Settings to choose the data columns you wish to see in the table. As column headings, Windographer displays very short labels that it assigns to the data columns according to their type. A data column containing temperature at 90m above ground, for example, will appear in this table as 'T90'. Hold the cursor over any column heading to see the full data column label in a tool tip:
Tip: Use Ctrl-Click to select multiple blocks of cells in the table.
Use the checkboxes labeled Data columns to select the data columns that you wish to flag or unflag. If you have checked the checkbox labeled Update this list when I select a segment, then each time you select a time interval on the graph, Windographer will automatically check only the data columns that appear in that graph. Similarly, each time you select a block of cells in the table, Windographer will automatically check the corresponding data columns.
From the drop-down box, choose the flag you wish to apply or remove. This drop-down box will list all the flags defined for the current document. You can manage this list of flags in the Define Flags window.
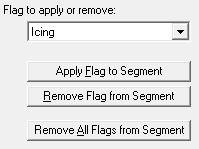
Click Apply Flag to Segment to apply the flag you have chosen to the time interval and data columns that you have chosen. The process of removing a flag from a data segment is exactly analogous. Choose the time interval, the data columns from which to remove the flag, and the flag you wish to remove, and then click Remove Flag from Segment. If you click Remove All Flags from Segment, Windographer will remove all flags from the selected data segment, regardless of the flag you have chosen in the drop-down box.
You can use keyboard shortcuts for these three apply and remove commands:
Tip: When you flag or unflag a data column, Windographer automatically flags or un-flags its associated data columns as well.
See also
Inpsect and Remove Flags window
Associated Data Columns definition