
| Flag By Scatter Plot Window | |
This window allows you to flag and unflag data segments by clicking and dragging on a scatter plot. To access it, choose from the menu.
Start by choosing the data columns to display on the x- and y-axes. You can see the flagged points color coded by checking the Color code by flag box. For instance, a point on the scatter plot Speed 50m A vs Speed 60m will be colored red for tower shading if either column is has a tower shading flag for the time step. Flagged data points will only appear in the graph if the you include the relevant flag in the filter by flag settings.
Then select one or more data points on the graph by clicking individual points or by clicking and dragging to select all the points inside a shape. You can select points within a free-form, rectangular, or triangular shape:
The free-form selection mode works well for selecting irregularly-shaped collections of points:

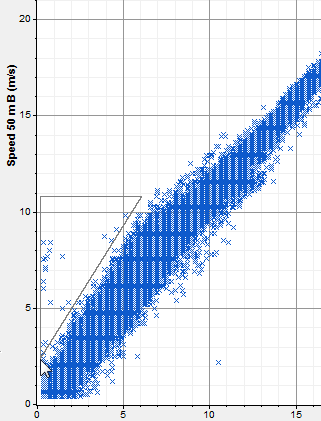
The triangular selection mode works well for selecting points that deviate from the line of best fit:
When selecting points on the scatter plot, hold down the Shift key or the Ctrl key to add to your current selection of points. Otherwise your new selection will replace your current selection.
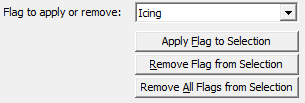
Once you have selected one or more points, use the checkboxes to specify the data column(s) that you wish to flag, choose the flag you wish to apply or remove, and click the appropriate button to apply or remove the flag.
You can use keyboard shortcuts for these three apply and remove commands:
The help article Using a Scatter Plot as a Quality Control Tool provides an example of using this window for quality control.
Tip: When you flag or unflag a data column, Windographer automatically flags or un-flags its associated data columns as well.
See also
Inspect and Remove Flags window
Using a scatter plot as a quality control tool