
| Flag Tower Shading Window | |
This window helps to automate the flagging of tower shading, which is the most drastic effect of tower distortion. It automatically generates the flag rules necessary to flag all tower shading events. To use this window, all you need to do is open it, verify that it has correctly generated the rules, and then let it execute them. To access this window, choose from the menu.
Tip: Windographer will make this window available only if you are using the Professional edition. Please visit www.windographer.com for information on the pricing and capability of each edition.
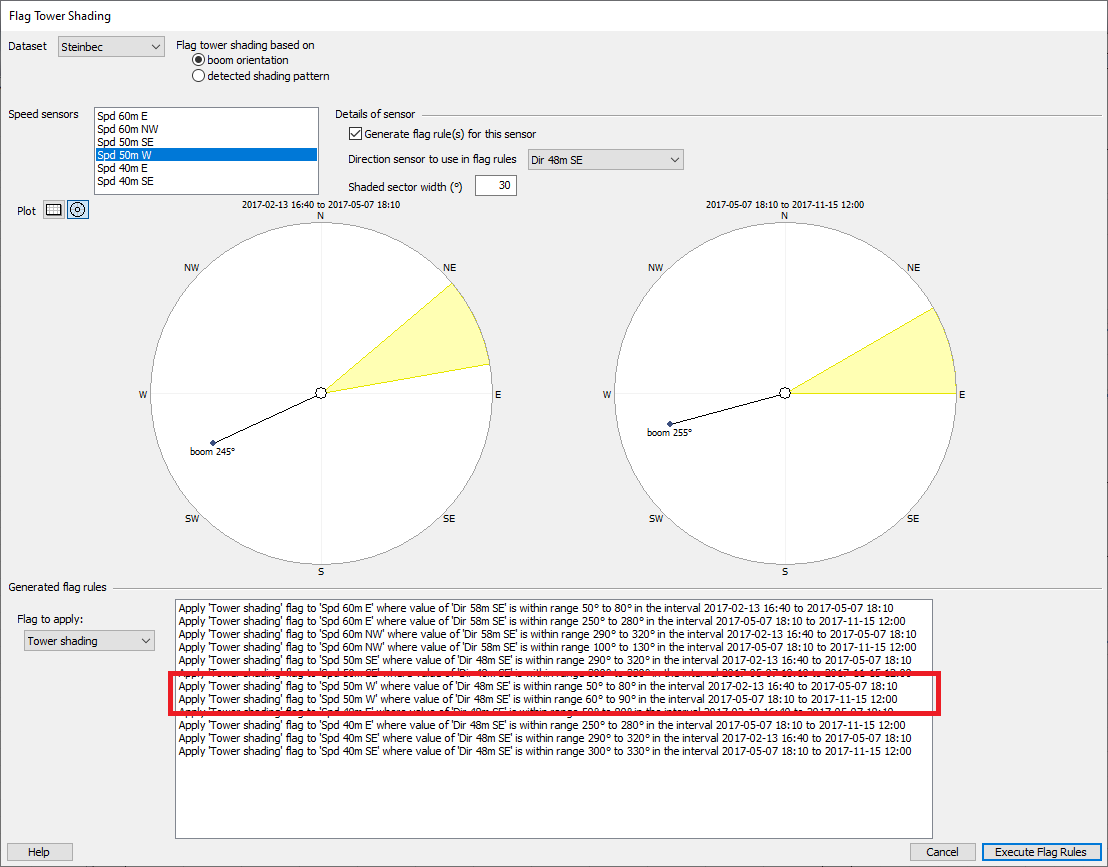
If you have specified boom orientations, this first option will generate rules to flag each speed sensor whenever its boom is downwind. You can choose the direction sensor with which to define direction; it defaults to the one nearest in height to the speed sensor of interest. You can also specify the size of the shaded sector; it defaults to the value you specify in .
If a speed sensor's boom orientation changes in time, then for each orientation the window will generate an appropriate rule limited to the appropriate date range. In the example below, the boom orientation changes by ten degrees on May 7th, resulting in one flag rule for before the change, and one for after:
If you have not specified boom orientations, Windographer can infer them automatically by analyzing the relative behavior of colocated wind speed sensors versus direction. This process assumes that boom orientations do not change in time, and if that assumption is incorrect this second option can perform poorly.
For every pair of visible static colocated wind speed sensors, Windographer calculates the ratio of the speeds reported by the sensor pair in each time step, then finds the median value of those ratios in each of 72 direction sectors. The highest and lowest of those median values coincide with the centers of the shaded sectors. The shaded sectors appear highlighted in the graphs:

You can enter the width of the shaded sectors. The default value comes from . With the checkbox labeled Generate flag rules for this sensor pair you can tell Windographer whether or not to flag tower shading events in these sensors. You may, for example, choose to flag one pair of sensors but not another.
At the bottom of the window appears the list of generated flag rules. This list updates immediately to reflect changes in the settings above. By default, the flag rules apply the special tower shading flag, but the drop-down box lets you specify a different flag if you wish. Click Execute Flag Rules to execute the rules and close the window. A record of doing so will appear in the Document History window.
Tip: You could write your own flag rules to accomplish the same thing. This window simply saves time by writing the rules for you.
For detecting the tower shading pattern, this window uses a variant of default flag filtering. It includes data flagged with the special tower shading flag, even if its properties indicate that it should be excluded by default. It does this so that the tower shading signal remains strong even if you have previously flagged tower shading events in some or all of the dataset.
The Tower Distortion window displays similar graphs and lets you see the same information in tabular form. It also allows filtering and subdividing by year and month.
See also