
| Turbulence Window | |
This window allows you to observe how the turbulence in the wind varies with height, wind speed, wind direction, month, or hour of day. To access it, choose from the menu.
Note: The Turbulence Analysis function is only available if the current data set contains at least one wind speed data column that has a corresponding standard deviation column or an associated turbulence intensity column.
From the Dataset drop-down box choose <all selected> to switch the window to multi-dataset mode, where it displays summary information about each of the selected datasets. Or choose a specific dataset to switch the window to single-dataset mode, which displays more detailed info about that one dataset.
The Display turbulence versus drop-down box allows you to display turbulence versus height, wind speed, wind direction, month, or hour of day. In the Wind speed sensor drop-down box, Windographer lists each wind speed data column that has a corresponding standard deviation column. You can also choose to display the information for all of the wind speed sensors:
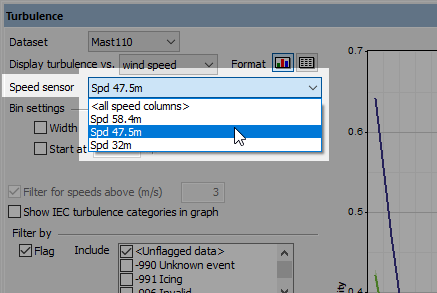
If the wind speed data column you are looking for does not appear in this drop-down box, you must return to the Configure Dataset window and associate a standard deviation column with that wind speed data column. Also check that the wind speed data column is visible.
Below that appear the bin settings, if you have chosen to display versus wind speed, or the direction sensor and number of direction sectors if you have chosen to display versus direction. Windographer with automatically choose reasonable bin settings, but you can override them if you wish.
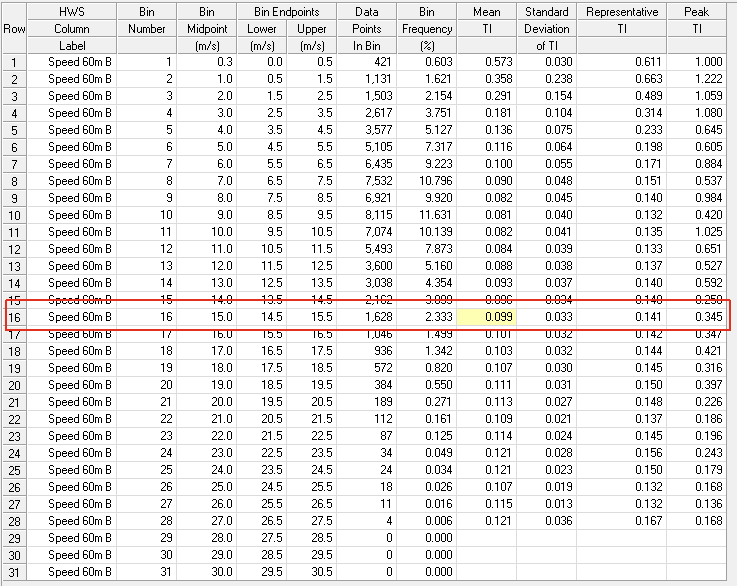
Use the Format buttons to see the results in graphical or tabular form. The tabular results report additional information including the standard deviation of the TI and the number of time steps included in the calculation TI.
The Filter by section allows you to analyze turbulence for a subset of your data. Windographer disables direction filtering when you view turbulence versus direction and disables month filtering when you view turbulence vs. month. For more information see the article on filtering data.
To analyze turbulence, Windographer performs the following steps:
Windographer calculates turbulence intensity values using the following equations, which assume that the distribution of TI values in the relevant bin conform to the normal distribution:
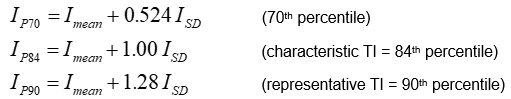
where: | ||
| Imean | is the mean turbulence intensity in the relevant bin | |
| ISD | is the standard deviation of the turbulence intensity in the relevant bin |
The example below shows that the data column Speed 60m B contained 1628 time steps that satisfied the filter criteria, that contained valid data in both the selected wind speed data column and its associated standard deviation data column, and in which the wind speed fell within the 14.5 - 15.5 m/s range. The resulting 1628 values of turbulence intensity exhibited a mean value of 0.099 and a standard deviation of 0.033, giving a representative turbulence intensity of 0.099 + 1.28 * 0.033 = 0.141. The peak value from those 856 values of turbulence intensity was 0.345.
When you display turbulence verses height, summary results appear in a table at the bottom of the window. This table summarizes the turbulence for each wind speed sensor, and shows particularly the 15 m/s data. Most of these 15 m/s values also appear in the turbulence vs wind speed table: the number of records in that bin, the mean turbulence intensity in the bin, and either the characteristic turbulence intensity or the representative turbulence intensity in the bin, depending on which edition of the IEC standard you have selected. The table also reports the IEC turbulence category that results from these 15 m/s statistics, based on the tabular data in the standard.
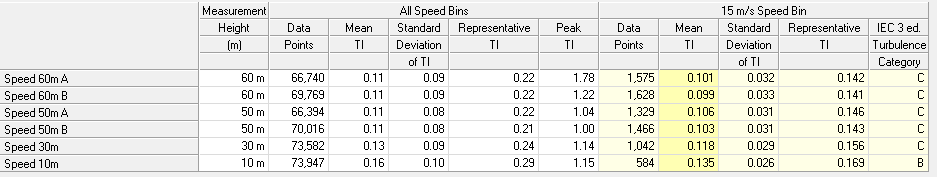
The summary table will be blank if there is not valid wind speed and standard deviation data at 15 m/s. This could happen with a very short dataset, a low wind regime, or if the data filter is used to impose a maximum wind speed limit.
Standard 61400-1 of the International Electrotechnical Commission forms the basis of Windographer's treatment of turbulence intensity data. The 3rd edition of that standard, released in 2005, differs in approach from the earlier 2nd edition, released in 1999.
Note: You can choose whether you want Windographer to present results consistent with the second edition or the third edition of the IEC standard on the General tab in the Tools> Options window.
The 2nd edition of IEC 61400-1 defines three turbulence categories based on the characteristic turbulence intensity at a wind speed of 15 m/s:
| Turbulence Categories defined in IEC 61400-1 2nd Edition | ||||||||
|
The 3rd edition of IEC 61400-1 provides a tabular reference for four turbulence categories based on mean turbulence intensity at a wind speed of 15 m/s:
| Turbulence Categories defined in IEC 61400-1 3rd Edition | ||||||||||
|
If you choose the 2nd edition IEC standards, Windographer will display the mean turbulence intensity, the characteristic turbulence intensity, and the peak turbulence intensity versus whatever you have chosen as the independent variable. If you choose the 3nd edition standards, Windographer will display the mean turbulence intensity, the representative turbulence intensity, and the peak turbulence intensity versus the independent variable.
IEC Standard 61400-1 features a graph of the turbulence versus wind speed for each turbulence category. If you have chosen to display turbulence versus wind speed, you can select Show IEC turbulence categories in graph to include the IEC turbulence category boundaries. If you choose the 2nd edition IEC standards, Windographer will display the characteristic turbulence intensity in each wind speed bin along with the IEC turbulence category boundaries. If you choose the 3nd edition standards, Windographer will display the representative turbulence intensity in each wind speed bin along with the IEC turbulence category boundaries.
Tip: In the 3rd edition IEC standards, the category table shows mean turbulence intensity, but the equation and graph show representative turbulence intensity. You may want to consider both mean and representative TI to determine the turbulence category.

See also
Characteristic turbulence intensity
Representative turbulence intensity