| Data Coverage Window |  |
This window provides information about missing and flagged data and lets you see patterns in the data recovery rate versus height, month, hour of day, direction sector and other variables. To access this window, choose from the menu.
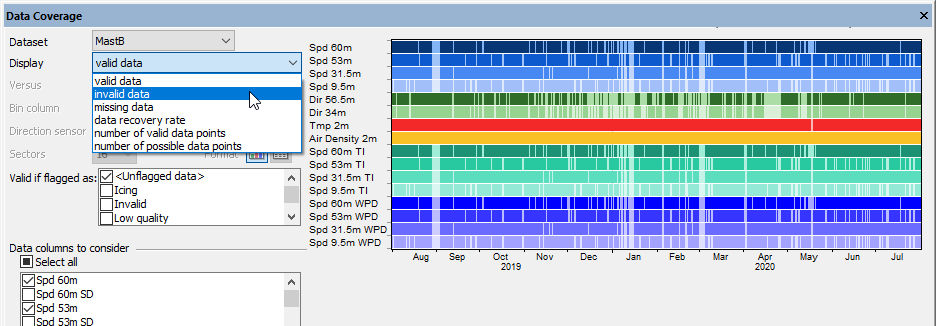
The first three Display options display a data coverage chart showing valid, invalid, or missing data.

Tip: The resolution of these charts is likely much smaller than your data; tens of thousands of time steps may be represented by a few hundred pixels. To see an accurate representation of the data, you may need to zoom in to a specific time period by filtering by date or date range.
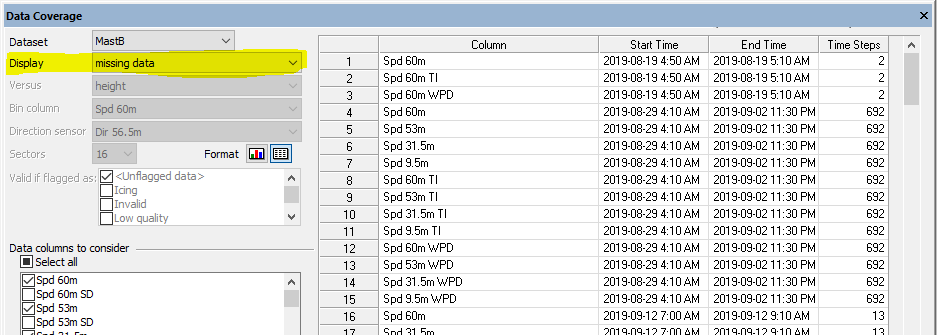
In the case of missing data, you can choose tabular mode to see a list of missing data segments:

The other display options let you display data recovery rate or the two values from which it is calculated: the number of valid data points and the number of possible data points. You can display these variables versus height, month, hour of day, and several other dimensions.

To calculate the data recovery rate, Windographer divides the number of valid data points by the number of possible data points. A data point is valid if it meets two conditions:
The Valid if flagged as checkboxes allow you to define validity for the purposes of this window. A checkbox will appear for each flag that has been applied to the current dataset. If you want to consider data points flagged with the 'Icing' flag as valid for the purposes of calculating data recovery, then check the 'Icing' checkbox. Otherwise do not check that checkbox.
In the example below, if you choose to consider only unflagged data as valid, then Windographer shows this data coverage chart with many invalid segments:

But if you expand your definition of 'valid' to include data flagged as 'Tower Shading', many of the gaps in the data coverage chart now appear filled in, and fewer invalid segments:

As another example, consider a data column that covers 10,000 time steps, of which 800 are missing and 650 are flagged as 'Tower Shading'. If you choose to consider only unflagged data as valid, then Windographer will report 8,550 valid data points, for a data recovery rate of 85.5%. But if you expand your definition of 'valid' to include data flagged as 'Tower Shading', Windographer will report 9,200 valid data points for a data recovery rate of 92%.
Tip: When you choose to display versus month, the start and stop date of the data set affect the number of possible data points. If a five-month dataset ends after the first week of February, for example, its number of data points in February will equate to only a quarter of the total number of time steps in February.
You can choose to consider any subset of data columns in the calculation of the data recovery rate. The list of Data columns to consider will contain one checkbox for every data column in the dataset, including calculated data columns. If you choose to consider multiple data columns, Windographer will display the aggregate data recovery rate for all selected data columns, and in some display formats it will also display the data recovery rate for each of those data columns individually.
When displaying data recovery versus height, Windographer will only consider those data columns that have an associated measurement height, such as speed and direction columns. (You can specify measurement heights in the Configure Dataset window.) If you choose to consider multiple data columns that share a particular measurement height, Windographer will aggregate the results for those data columns, as shown in the table below. In the tabular view, Windographer reminds you of this by showing the number of data columns at each height:

The Filter by section of the window allows you to focus on a particular subset of your data, such as a particular month, a particular year, a particular temperature range, and so on. Filtering the data will affect the number of possible data points. For more information on filtering see the article on filtering data.
Right-click any graph to change its properties, copy the image to the clipboard, or export it to a file. Right-click on any table to export it to a file, or copy it. See the article on exporting graphs or exporting tables for more information.
See also