
| Wind Shear Window | |
This window lets you analyze the variation of both wind speed and direction with height above ground. To access this window, choose from the menu.
For information on how Windographer calculates the wind shear parameters, please refer to the articles on surface roughness, power law exponent, and wind veer rate.
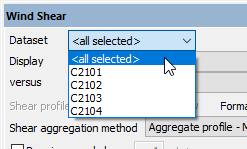
Start by choosing a dataset, or choose <all selected> to enter multi-dataset mode:
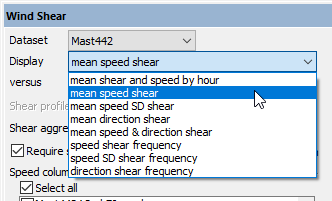
Then choose from the Display drop-down box, whose contents depend on whether the window is in single-dataset mode or multi-dataset mode.
This display mode shows either a graph or a table of mean speed and the power law exponent by hour of day. The speed data that appears in the graph comes from the primary speed column, or if you have excluded that column from these calculations, the highest speed column that you have included.

If you choose to display mean speed shear, you can subdivide the data by month, time of day, direction sector, and other data columns like wind speed or temperature as well as pairs of these options, like direction sector and month. Windographer calculates the mean wind speeds and the best-fit surface roughness or power law exponent in each subdivision. The example below shows the power law exponent versus month and hour of day.

Tip: You can set the maximum height wind shear profile graph in the Options window.
Use the list of checkboxes to choose the wind speed sensors on which you want to base the shear calculations. Reasons why you may wish to select only a subset of the available wind speed sensors include:
To calculate the mean wind shear over multiple time steps, Windographer uses the shear aggregation method that you select.
For some customers, two additional display options appear in this window that always use the 'Time series - mean' shear aggregation method.
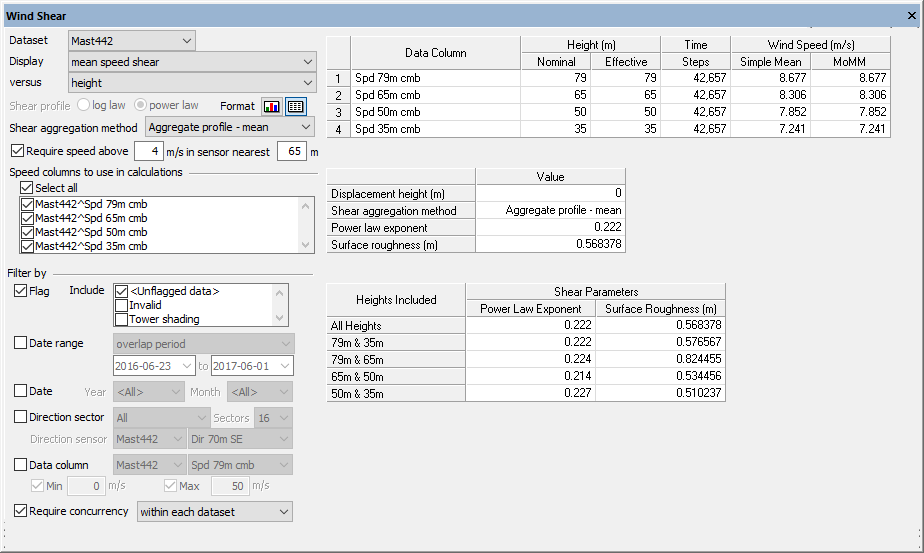
If you display mean speed shear by height and choose tabular format, one table reports the simple mean and MoMM speeds for each sensor, while a second table shows the resulting best-fit shear parameters. If you choose an 'aggregate profile' shear aggregation method, a third table appears showing the best-fit shear parameters calculated from:
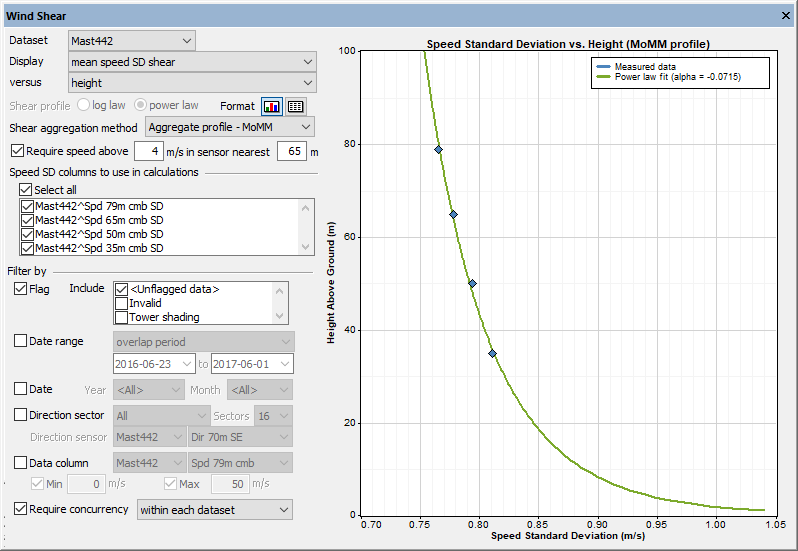
This display mode lets you explore the change in height of the standard deviation of wind speed. Because the speed SD shear is so commonly negative, Windographer always reports speed SD shear in terms of power law exponent, even if you have specified in the Configure window that you prefer the logarithmic law.
The example below shows a typical pattern of the mean speed SD decreasing with height, closely approximated by a power law with a negative exponent:
If you have wind direction measurements at two or more heights, Windographer can calculate the change in direction of the wind with height above the ground, called wind veer rate.
If you choose to display mean direction shear, you can subdivide by month, time of day, direction sector, and other data columns. Windographer calculates the vector mean wind direction and the wind veer rate in each subdivision.
To find the mean wind direction in a given period or subdivision of the data, Windographer calculates the vector mean, which requires both direction and magnitude. This window provides three options for the magnitude: the associated speed sensor, the primary speed sensor, or no speed sensor:
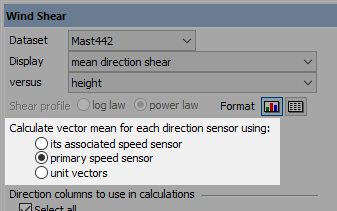
The first option, to define the vector magnitude using the speed sensor associated with each direction sensor, seems natural but it can make the results difficult to interpret since the vector mean calculations may use a different speed sensor for each direction sensor.
The second option, for each direction sensor's vector mean calculations to use the dataset's primary speed sensor, is the default option since it usually leads to results that are easier to interpret. It means that in each time step, the vector mean calculation uses the same speed for each direction sensor. It also means that the availability of valid speed data is consistent across all direction sensors.
The third option, to use no speed sensor at all, is equivalent to assuming unit vectors in vector mean calculations. This avoids the need for valid speed data, so it can be the best option in cases where the dataset contains many missing or invalid speed values.
Note that you can associate a wind speed sensor with each direction sensor in the Configure Dataset window.
Use the list of checkboxes to choose the direction sensors on which you want to base the shear calculations. By default Windographer includes all the direction sensors, but you may wish to select only a subset if some are more accurate than others, if you wish to focus on a particular height range, or for some other reason.
If you choose to display mean speed and direction data, Windographer displays a hodograph with one arrow for each direction sensor, where the azimuth of each arrow reflects the vector mean direction for that direction sensor, and the length of each arrow reflects the mean reported by the associated wind speed sensor. An example appears below:

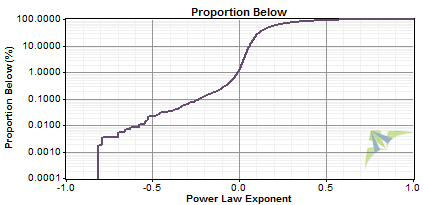
If you choose to display the speed shear frequency, Windographer calculates the wind shear parameter in each time step and produces a frequency histogram showing how frequently the value falls within various bins. You can see that histogram in graphical or tabular format, as well as logarithmic graphs that highlight the upper and lower ends of the distribution.
The graph below, for example, shows that the power law exponent falls below zero about 1% of the time, and below -0.6 about 0.01% of the time:
If you choose to display the speed SD shear frequency, Windographer calculates the shear parameter for the speed standard deviation values in each time step and displays the resulting frequency histogram.
If you choose to display the direction shear frequency, Windographer calculates the wind veer rate in each time step and produces a frequency histogram that you can see in graphical or tabular format. You can also see logarithmic graphs that highlight the upper and lower ends of the distribution.
Shear and veer can vary by season. If your dataset is seasonally biased, you can set the shear aggregation method to 'Aggregate profile - MoMM', which calculates shear from mean of monthly means wind speeds to compensate for seasonal bias. Each of the four shear aggregation methods has advantages and disadvantages.
The filter settings allow you to focus on a subset of your data. The article on filtering data gives full details. Of primary importance in this window is the wind speed filter and the concurrency requirement. You control the wind speed filter with this set of controls:
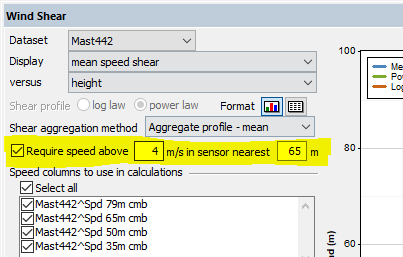
The minimum speed defaults to 4 m/s and the target height defaults to the height of the primary speed sensor.
You control the concurrency requirement with this set of controls:
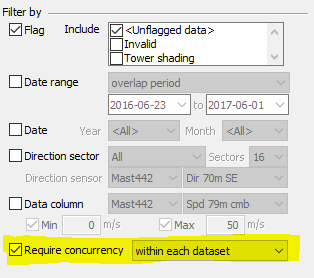
If you require concurrency within each dataset, then when calculating mean speeds and vector mean directions for a dataset, Windographer considers only those time steps that contain valid data from all of the data columns from that dataset that you have chosen to use in the shear calculations.
If you require concurrency across datasets, then Windographer looks across all of the data columns that you have chosen across all datasets, and uses in its calculations only those time steps that contain valid data in every one of those data columns. This can require resampling if the datasets span different time contexts.
If you require no concurrency of either kind, then the mean speeds and directions that Windographer calculates in this window should match those it calculates elsewhere such as in the Wind Speed Sensor Summary table, given equivalent filter criteria. Otherwise, the concurrency requirement will often cause the mean values reported in this window to differ from those reported elsewere for the same data columns.
The Vertical Extrapolation window does some of the same calculations as the Wind Shear window, but gives less control. You can use the Wind Shear window to create a table of shear parameters according to your exact specifications, and then copy that table into the Vertical Extrapolation window. You can even do this across datasets, for example calculating a table of shear parameters from a LiDAR dataset, and then using that table to extrapolate a met tower dataset.
Right-click any graph to change its properties, copy the image to the clipboard, or export it to a file. Right-click on any table to export it to a file, or copy it. See the article on exporting graphs or exporting tables for more information.
See also
Wind Speed Sensor Summary table