
| Vertical Extrapolation Window | |
This window synthesizes speed, speed standard deviation, direction and temperature data at any height above ground, using observed shear patterns or the patterns that you specify. You may want to use this capability to estimate conditions at the hub height of a wind turbine, or at a number of heights for further wind flow modeling. To access this window, choose from the menu.
Tip: The procedure of extrapolating is inherently uncertain, and what happens in the observed layers does not always predict what happens above. Please use this feature with caution.
Use the check boxes in the top left corner to indicate the type of data you wish to synthesize. The settings for each type appears in a corresponding tab.
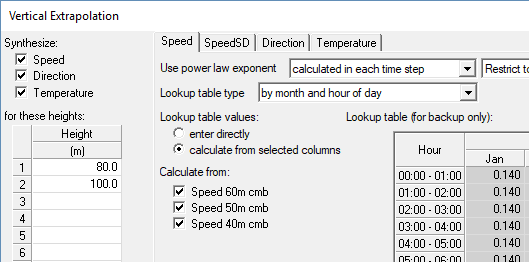
Enter one or more heights above ground for which you would like to synthesize data. When you click Extrapolate Windographer perfoms the extrapolation and creates new data columns to store the results. In large datasets this process may take several seconds. The OK button performs the same process and closes the window. A checkbox at the bottom of the window lets you choose whether to apply a flag to the new columns.
In the example above, Windographer will create 8 new data columns, including new temperature data columns at 80m and 100m, new direction data columns at 80m and 100m, new speed and speed SD columns at 80m and 100m. These columns will appear in the Configure Dataset window:
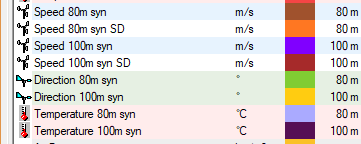
Once you have added the extrapolated data columns, you can graph and analyze them just like any other data column. Windographer automatically assigns a name and color to each synthesized data column, but you can make changes with the Configure Dataset window.
Note that when you click Extrapolate, Windographer begins with your original dataset and performs the extrapolation process using the current settings. If you change the settings and click Extrapolate a second time, the data columns created by the first extrapolation process are discarded and replaced by those created by the second.
The first drop-down lets you choose between two general approaches to vertical extrapolation. The first approach is to calculate the best-fit shear/veer/gradient parameter in every time step based on the measurements made in that time step, using a lookup table as backup. The second approach is to use a lookup table by itself:

The next two sections describe these two approaches.
If you choose this approach, Windographer calculates the best-fit shear/veer/gradient parameter in every time step that it can do so, using the measurements made in that time step by the speed, direction, or temperature sensors that you specify below in the Calculate from section of the window. In time steps in which it cannot calculate the best-fit parameter, either because of missing or invalid measurements, or an unsuccessful curve fit, Windographer will refer to a lookup table.
The remaining controls allow you to specify precisely how you want the extrapolation to happen.

When calculating the best-fit shear/veer/gradient parameter, Windographer uses default flag filtering, meaning it includes data flagged to include in calculations, and excludes data flagged to exclude from calculations. The number of values used to calculate the shear/veer/gradient parameter can change from one time step to the next because of gaps or flagged segments in some or all of the relevant data columns.
Tip: To see the time series of best-fit shear/veer/gradient in every time step, add a calculated column containing the parameter of interest.
If you choose to use the shear/veer/gradient parameter from a lookup table, then Windographer will refer to the lookup table in every time step to determine the parameter to use in that time step.

You can specify the dimensions and contents of the lookup table. If you choose calculate from selected columns, Windographer will fill the lookup table with values it calculates using the sensors you have selected with the Calculate from checkboxes and applying default flag filtering. These values will match the those that the Wind Shear Analysis or Temperature Profile window would calculate using their default settings. The default settings for wind veer, for example, appear below.
If instead you choose enter directly, you can type or paste values into the lookup table. These values can come from your own external calculations or from shear measurements made in another dataset. For example, you could extrapolate met tower wind speeds using a shear lookup table calculated from a nearby LiDAR dataset.
In addition to specifying the parameters, you must choose a sensor from which to extrapolate. Note that in any time step where that sensor lacks valid data, Windographer will not be able to calculate an extrapolated value. The extrapolated data column(s) will therefore contain no data in such time steps.
The lookup table options for speed, speed standard deviation, and direction are the same as those that appear in the Wind Shear window, and the options for temperature are the same as those that appear in the Temperature Profile window. The articles describing those windows explain the table types and the relevant calculation techniques. When calculating the mean speed shear and speed SD shear, Windographer uses the shear aggregation method you have specified in the Configure window.
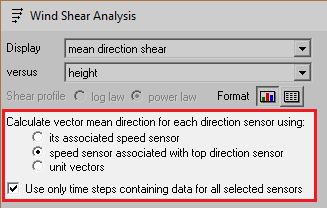
For some customers, this window offers two customer-specific display options that always use the 'Time series - mean' shear aggregation method.
The shear and temperature analysis windows allow you to explore the patterns in shear, veer, and temperature gradient and they give you finer control over the calculations than does the Vertical Extrapolation window. For example, they allow you to adjust the flag filter settings, or to filter for wind speeds above a certain value. You can make these calculations in the analysis window, copy the contents of the table to the clipboard, and then paste that into the Vertical Extrapolation window.
This process of transferring data from the shear or temperature profile analysis windows to the vertical extrapolation window is one that you can use across datasets as well. For example, you could calculate a table of shear parameters from a LiDAR dataset, and then using that table to extrapolate a met tower dataset.
The Extrapolate from drop-down box gives additional control over the extrapolation process. If you have chosen to calculate the shear parameter in every time step, then you can choose either to extrapolate along the line best fit or to extrapolate from a specific sensor:

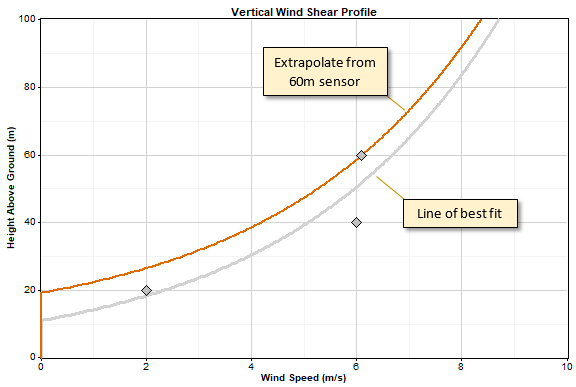
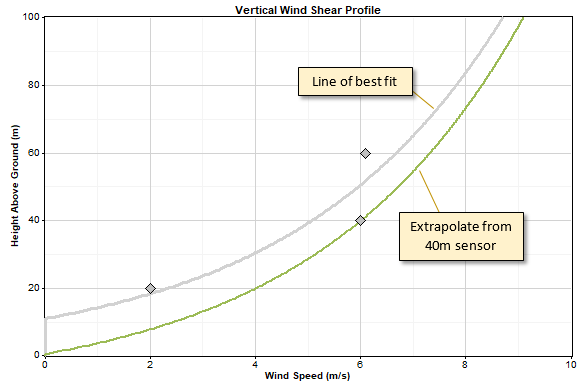
As an example, imagine that you wish to extrapolate wind speeds above from a met tower with anemometers at 20m, 40m, and 60m using the logarithmic law, and that you choose to calculate the shear parameter in every time step using all three sensors, and that in a particular time step the anemometers report speeds as shown in the graph below. If you choose to extrapolate from the line of best fit, then for the heights that you request, Windographer will synthesize speeds along the black line of best fit:

If, however, you choose to extrapolate from the 60m sensor, then Windographer will synthesize speeds that fall along the orange line in the following graph. The orange line has the same curvature – the same surface roughness – as the line of best fit, but it has been offset to pass through the 60m speed:
And if you choose to extrapolate from the 40m sensor, then Windographer will synthesize speeds that fall along the green line in the following graph. The green line has the same curvature as the line of best fit, but it has been offset to pass through the 40m speed:
You will not have the option to extrapolate along the line of best fit if you choose not to calculate the speed parameter in every time step. That's because in that case Windographer does not calculate the line of best fit in each time step.
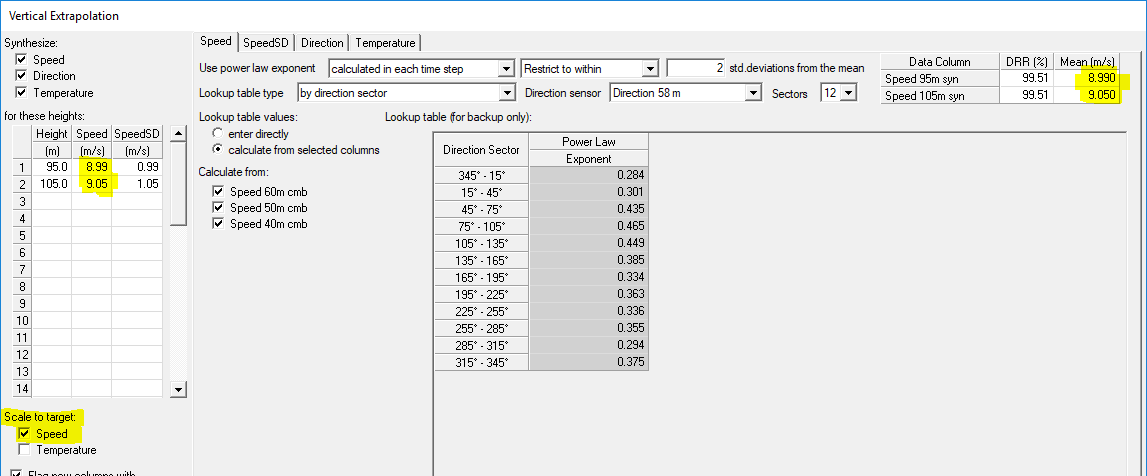
The checkboxes below the table of heights give you the option to enter target values of speed, speed SD, or temperature. If you enter a target value, Windographer will generate the extrapolated time series as usual, but then it will rescale the time series so that its simple mean matches the target value.
The screenshot below shows that the resulting simple mean wind speeds match the target values that the user entered:
Similarly, the SpeedSD tab shows that the mean of the standard deviation columns also matches its target values:
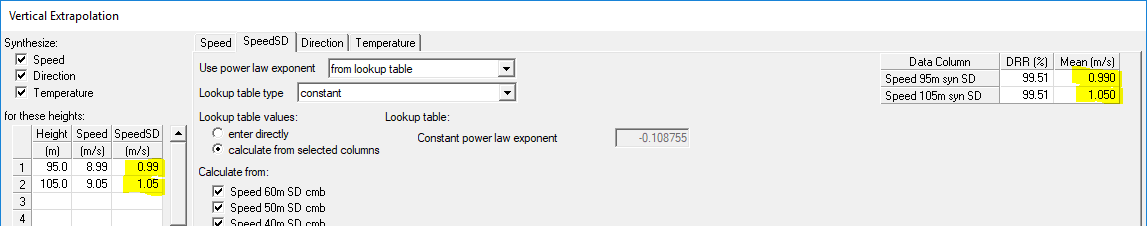
Leave a cell blank if you do not wish to rescale the extrapolated time series. In the example below, the user has rescaled the speed standard deviation at 95m, but not at 105m:
![]()
The Test button allows you to compare the extrapolated speed data with an expected time series in the Extrapolation Test Results Window.
Windographer cannot synthesize data from nothing. For instance, Windographer cannot create a temperature column at a specified height unless there is at least one temperature data column in the dataset. The same is true for speed, speed standard deviation, and direction data.
If your dataset contains wind speed standard deviation data, then Windographer will also extrapolate standard deviation data when you choose to extrapolate wind speed data.
See also
Wind Shear window (also covers wind veer)
Extrapolation Test Results Window
Temperature gradient definition