
| Temperature Profile Window | |
This feature is coming soon to Windographer 5.
The Temperature Profile window allows you to observe patterns and extreme occurrences in the vertical temperature profile and the temperature gradient. To access this window, choose from the menu.
Tip: The Temperature Profile window is only available if the current dataset contains at least two temperature sensors at different heights.
The Display drop-down box lets you choose between two modes. If you choose to analyze the mean temperature gradient then Windographer will subdivide the dataset in one of several ways (by month, time of day, direction sector, etc.) and in each subdivision calculate the mean temperature profile and the resulting temperature gradient. If you choose to analyze the temperature gradient frequency, then Windographer will calculate the temperature gradient in each individual time step, and display the frequency distribution of those individual values.
A checkbox appears for each temperature sensor in the dataset. Use these checkboxes to include or exclude sensors from the analysis as you wish. To calculate the temperature gradient, Windographer requires at least two temperature sensors at different heights.
The checkbox labeled Use only time steps containing data for all selected sensors lets you decide whether to enforce the concurrency requirement, which is a restriction that helps helps to focus the analysis on temperature differences related to height, rather than measurement period or data recovery rate. For details, please see the article on the concurrency requirement. Note that checking this checkbox can have a large impact in cases of low data recovery.
To calculate the temperature gradient, Windographer performs the following steps:
In this mode you can observe how the mean temperature gradient varies with height, wind direction, data column, month, hour of day or a combination of these factors.

If you choose to display shear versus direction sector, you can select the direction sensor on which to base the definition of direction sector. The number of direction sectors will default to the value that you have specified in your preferred wind rose settings in the Options window, but you can change this value via the drop-down box.
Use the Format buttons to see the results in graphical or tabular form. In many cases, the tabular results report information that does not appear in the graphs, including the mean temperature for each temperature sensor, and the number of time steps included in the calculation of that mean.
If your setting requires more input, Windographer will automatically display the necessary controls, such as the bin settings when appropriate. Windographer with automatically choose reasonable bin settings, but you can override them if you wish.
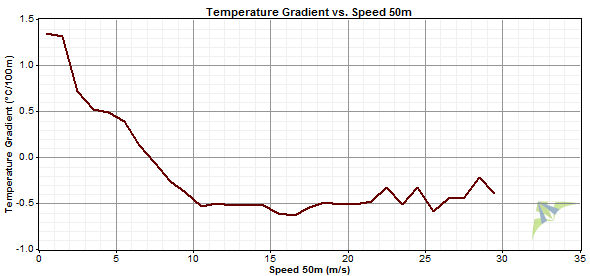
The example below, showing temperature gradient versus a wind speed data column, indicates that the temperature gradient decreases with increasing wind speed.
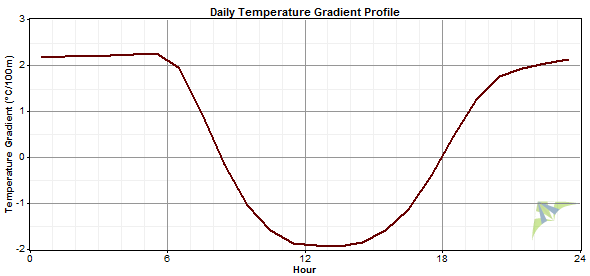
The second example, below, plots temperature gradient versus hour of day. It indicates that on average, during the middle of day (08:00 to 20:00) the temperature gradient is negative, which means that the temperature decreases with increasing height. This commonly occurs due to the sun warming the surface and the layers of air nearest the surface. The next graph, showing temperature gradient versus height and hour of day, shows the same effect. The three green lines in the middle of the day show the warmest temperatures nearest the surface, whereas overnight the surface becomes cooler than the air above.

In this mode you can observe how frequently certain temperature gradient values occur. Windographer calculates the temperature gradient in every individual time step, and displays the frequency histogram of that set of numbers, along with graphs highlighting the upper and lower end of the distribution. Note that Windographer displays in the top left corner of the window the total number of number of time steps in which it calculated the temperature gradient.
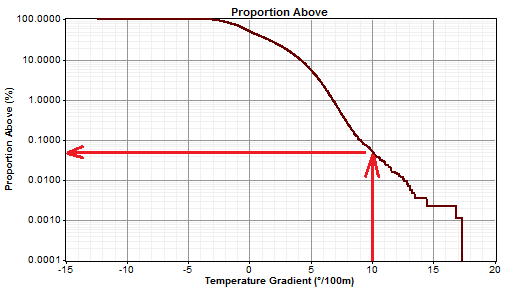
The Proportion Below graph shows the cumulative distribution function with a logarithmic y-axis to highlight the lowest values of the temperature gradient. The Proportion Above graph shows the same information except the y-axis now shows 100% minus the value of the cumulative distribution function (to highlight the highest values of the temperature gradient). The example below shows that the temperature gradient exceeded 10°/100m about 0.05% of the time:
The Filter by section allows you to focus the analysis on a subset of your data. Windographer disables some of the filter controls under certain conditions. When you plot versus direction sector, for example, it disables the direction filtering controls. When you plot versus month it disables the month drop-down box. For details, please see the article on filtering data.
Right-click any graph to change its properties, copy the image to the clipboard, or export it to a file. Right-click on any table to export it to a file, or copy it. See the article on exporting graphs or exporting tables for more information.
See also
Temperature Gradient definition