| Temperature Gradient |  |
The temperature gradient is a number that characterizes the rate at which temperature changes with height above ground. It is the slope of the line of best fit that Windographer fits to the graph of temperature versus height. Positive values indicates that temperatures rise with increasing height above ground, and negative values indicate temperatures fall with increasing height above ground. Highly positive temperature gradients therefore indicate very stable conditions, whereas highly negative gradients indicate very unstable conditions.
Tip: Although meteorological textbooks typically specify an average temperature gradient (environmental lapse rate or atmospheric lapse rate) of about -0.65°C/100m throughout the troposphere, research indicates that in the lowest 100m of the atmosphere, the temperature gradient tends to vary widely, taking on both positive and negative values, and actually has a positive average value at most sites (Walter, 2011).
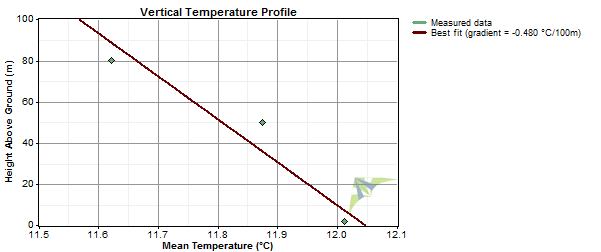
Windographer calculates the temperature gradient by using linear least squares to find the line that best fits the graph of mean temperature versus height above ground. The temperature gradient is the slope of that line. The graph below shows an example of temperatures decreasing with height above ground, leading to a negative temperature gradient:

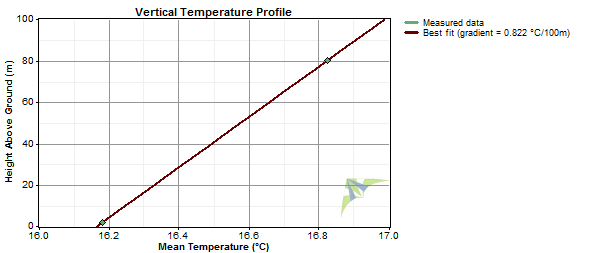
The example below shows the opposite scenario, where temperatures increase with height, leading to a positive temperature gradient:

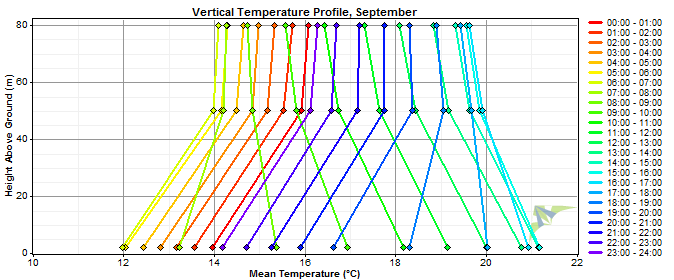
Note however, that the variation of temperature with height can often deviate from a linear relationship. The graph below, for example, shows over ten years of September data from the NREL M2 mast, which has temperature sensors at 2m, 50m, and 80m above ground. The graph shows the mean temperature profile for every hour of the day. Most of the 24 profiles have significant doglegs at 50m, indicating that most of the time the temperature varies nonlinearly with height within this height range. A dataset comprising only two temperature sensors cannot reveal these nonlinearities.

In the Temperature Profile window Windographer calculates the best-fit temperature gradient versus month, time of day, direction, wind speed, and other factors, and reports the frequency histogram and extreme values as well.
Tip: In the Configure Dataset window you can create a calculated data column containing the temperature gradient in every time step of the dataset.
See also
Temperature gradient calculated column