
| Surface Roughness | |
The surface roughness (sometimes called surface roughness length or just roughness length) is a measure of the rate at which the wind speed changes with height above ground. It is a parameter in the logarithmic law, which states that the wind speed varies logarithmically with the height above ground according to the following equation:
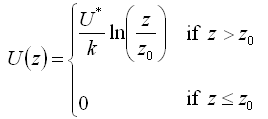
where: | ||
| z | is the effective height above ground [m] | |
| U(z) | is the wind speed [m/s] at some effective height z | |
| U* | is the friction velocity [m/s] | |
| k | is von Karman's constant (0.4) | |
| z0 | is the surface roughness [m] | |
| ln() | is the natural logarithm |
The graph below shows the effect of the surface roughness on the wind shear profile predicted by the logarithmic law. Each line on the graph corresponds to a different value of surface roughness, but all pass through a wind speed of 10 m/s at an effective height of 100m above ground:
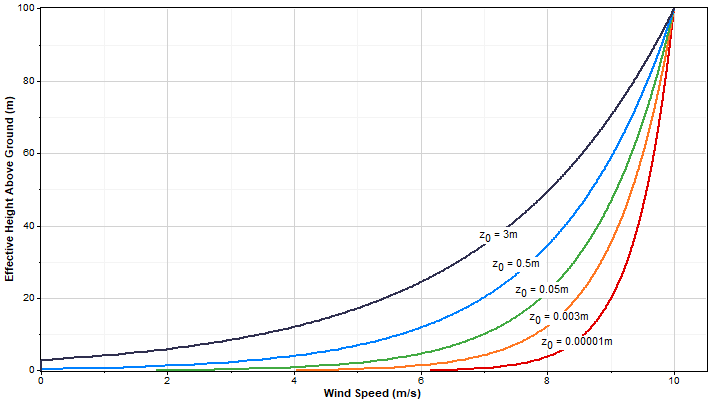
Different terrain types are characterized by different values of surface roughness. The following table shows typical surface roughness values for several types of terrain. Source: Manwell et al. (2002). Reproduced with permission.
| Terrain Description | Surface Roughness (m) |
|---|---|
| Very smooth, ice or mud | 0.00001 |
| Calm open sea | 0.0002 |
| Blown sea | 0.0005 |
| Snow surface | 0.003 |
| Lawn grass | 0.008 |
| Rough pasture | 0.01 |
| Fallow field | 0.03 |
| Crops | 0.05 |
| Few trees | 0.10 |
| Many trees, few buildings | 0.25 |
| Forest and woodlands | 0.50 |
| Suburbs | 1.50 |
| Centers of cities with tall buildings | 3.00 |
For datasets that contain wind speed data for two or more heights above ground, Windographer solves for the surface roughness value that best fits the measured vertical wind speed profile. We can use a linear least squares algorithm to fit this logarithmic profile to the measured wind speed data, but first we need to do some algebra. Using the rule ln(1/x) = - ln(x), we can rewrite the logarithmic law as follows:
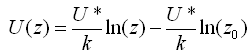
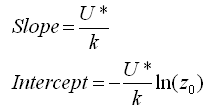
This equation is now in the general slope-intercept form: y = mx + b. A plot of wind speed versus the logarithm of height would therefore produce a straight line with:
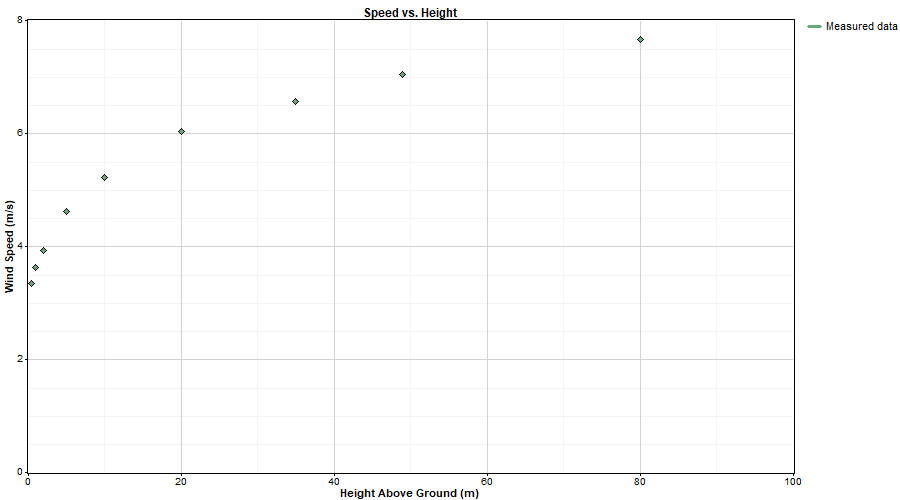
For example, the graph below shows the mean wind speeds measured by a met tower with anemometers at nine measurement heights between 0.5m and 80m above ground:
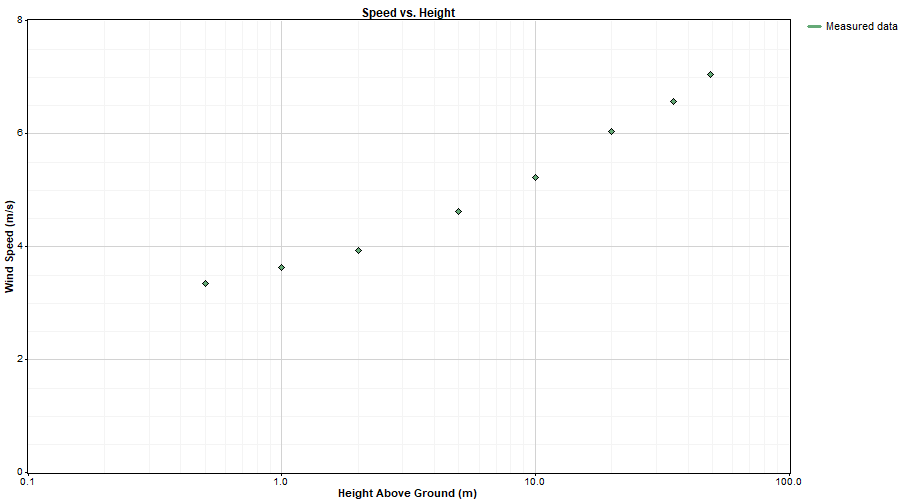
If we make the x-axis logarithmic, we get a more linear pattern:
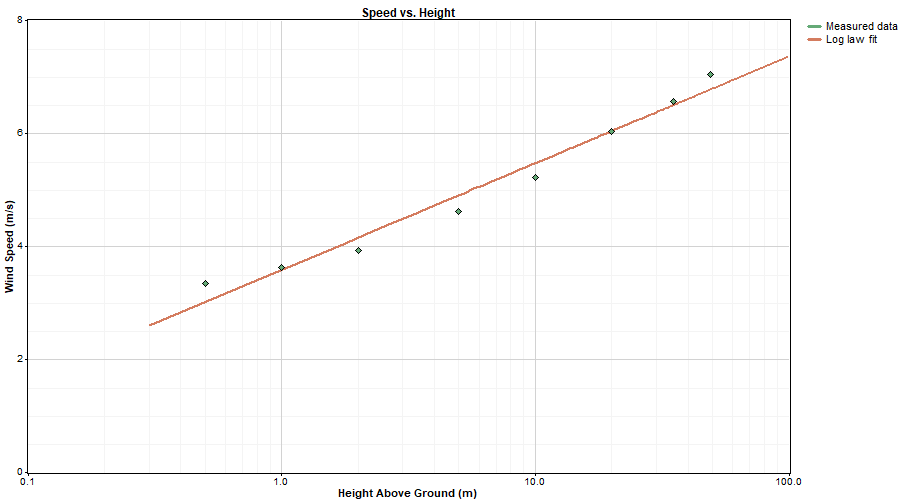
To calculate surface roughness, Windographer plots the speed versus natural logarithm of height and finds the line of best fit using linear least squares regression:
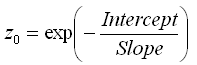
From that line of best fit, Windographer solves for the surface roughness using the following equation:
Windographer displays the overall best-fit surface roughness in the Dataset Summary table. In the Wind Shear window Windographer calculates the best fit surface roughness versus month, time of day, direction, speed, and other factors, and reports the frequency histogram and extreme values as well.
Windographer always reports surface roughness in units of metres, even in datasets that denominate heights above ground in units other than metres.
If you have multiple wind speed sensors at exactly the same height, Windographer will fit the shear profile using a single average value at each available height.
Windographer will only report surface roughness values greater than zero. If the slope of the speed vs. logarithm of height line is negative or it cannot calculate the slope, it will not report a surface roughness value.
Tip: In the Configure Dataset window you can create a calculated data column containing the surface roughness in every time step.
See also
Wind shear parameter calculated column