
| Mean of Monthly Means | |
The mean of monthly means (MoMM) is an average of the twelve monthly averages. Because it avoids seasonal bias, the MoMM often provides a better estimate of the long-term mean than does the simple mean.
Imagine, for example, a 13-month set of temperature data that includes two Augusts but only one of every other month. A simple mean of that dataset would include twice as much data from August as from any other month, so it would over-represent August. If the mean August temperature exceeds the annual mean temperature, the simple mean would be erroneously high due to the over-representation of August. By contrast, the MoMM would give the August mean the same weight as it would the July mean or the October mean. As a result, the MoMM would reflect the true long-term mean more accurately than would the simple mean.
As a second example, imagine an 18-month set of wind speed data measured at a site that experiences a six-month calm season and a six-month windy season every year. If that dataset covers two calm seasons and one windy season, a simple mean wind speed over the entire 18-month period would underpredict the long-term mean wind speed because it would comprise twice as much calm-season data as windy-season data. By avoiding this seasonal bias, the MoMM would better reflect the long-term mean wind speed.
Windographer calculates the mean of monthly means using the following equation:
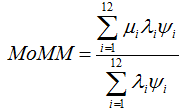
where: | ||
| mi | is the mean for month i | |
| li | is the completeness factor (defined below) for month i | |
| Yi | is the mean number of days in month i | |
The following table shows the mean number of days in each month:
| Month | Mean Number of Days |
|---|---|
| January | 31 |
| February | 28.24 |
| March | 31 |
| April | 30 |
| May | 31 |
| June | 30 |
| July | 31 |
| August | 31 |
| September | 30 |
| October | 31 |
| November | 30 |
| December | 31 |
| Total | 365.24 |
The 'completeness factor' is a number between 0 and 1 indicating the quantity of data that the dataset contains for each month. For example, a dataset starting in mid-March and ending three-quarters of the way through September, as depicted in the image below, will have completeness factors of zero for January and February, 0.5 for March, 1 for April through August, 0.75 for September, and zero for October through December.
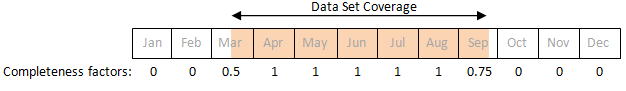
The completeness factor can never exceed 1 though, so if the dataset covers two full Januaries, the January completeness factor will equal 1.
Windographer uses the following equation to calculate the completeness factor for each month of the year:
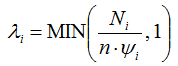
where: | ||
| Ni | is the total number of valid data points for month i | |
| n | is the number of time steps per day | |
| Yi | is the mean number of days in month i |
The denominator in the above represents the number of data points required to have a complete month of data. For ten-minute time steps, n = 144, and if we take April for an example month, Yi = 30, so the denominator is 144 * 30 = 4,320. Therefore, a dataset that contains 4,320 or more valid April time steps, whether they occur in a single April or in many Aprils over many years, will have an April completeness factor of 1. A dataset that contains fewer than 4,320 valid April time steps will have an April completeness factor of less than 1.
Note that the Advanced tab in the Options window lets you prevent Windographer from using fractional completion factors in the calculation of the mean of monthly mean. If you choose not to calculate fractional completeness factors, Windographer will set the completion factor to 1 for any month for which the dataset contains data, or 0 otherwise. With this simplification, the dataset that extends from mid-March through late September would have a monthly completion factor of 1 for March through September, and 0 for all other months.
The use of fractional completeness factor in the MoMM equation avoids bias even if the datasets is shorter than one year, or for whatever reason has very incomplete coverage of one or more months. The examples section below demonstrates this risk.
The MoMM proves particularly useful for datasets covering more than one year because it removes seasonal biases such as those in the 13-month and 18-month datasets described above. If the dataset covers at least one year, then all twelve months will have a completeness factor of one, and the equation for MoMM simplifies to:
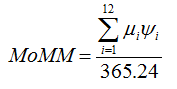
where: | ||
| mi | is the mean for month i | |
| Yi | is the mean number of days in month i | |
Windographer reports the mean of monthly means in several places, including the Data Columns table, the Monthly Statistics table, the Wind Speed Sensor Summary table, the Data Channel Summary table, the Wind Power Class window, the Wind Shear window, and when exporting TAB files.
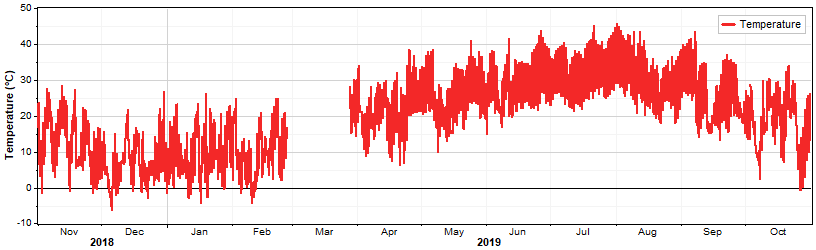
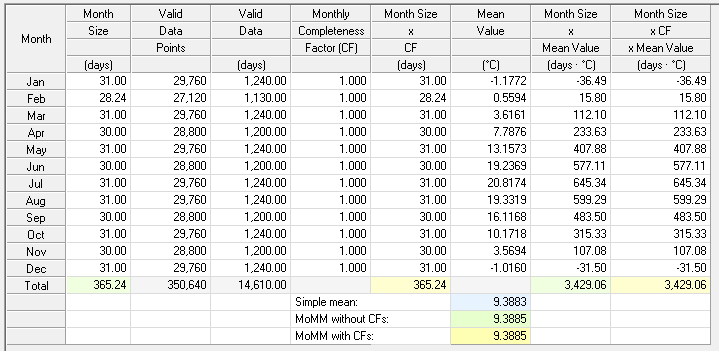
The mean of monthly means table shows the intermediate calculations that go into the MoMM, so we will use it to look at a few examples. First, consider a typical seasonally-biased dataset covering two winters and only one summer. The simple mean reflects the winter bias, but the MoMM avoids this bias and reports a higher mean temperature, more representative of the long-term expected mean:
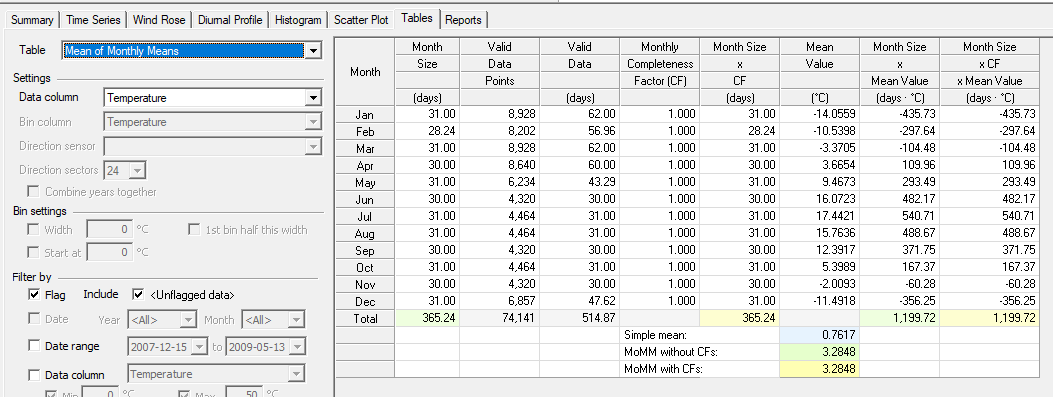
In the above example, note that the completeness factor (CF) is one for each month. That means the time series contains more than enough valid January data for the January mean to be given the full weight of January, more than enough valid February data for the February mean to be given the full weight of February, and so on.
But consider the following temperature time series, which lacks valid data in late February and most of March:
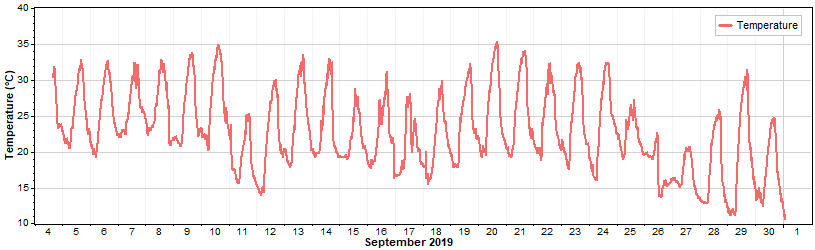
In this example the completeness factor (CF) for March is much lower than one, and note that the March mean temperature is quite high -- higher than the April mean temperature in fact:
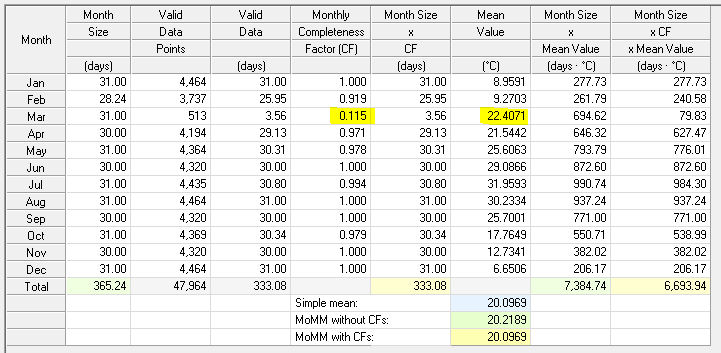
That high March mean temperature results from the fact that we only captured valid data from the last few days of March, which were probably warmer than the true March mean temperature. The completeness factors account for this shortage of data, and give the March mean a correspondingly lower weight in the MoMM. The simpler MoMM without CFs bravely gives the March mean full weight, leading to a slightly higher value of MoMM.
Now consider a more extreme case where a short time series just barely extends into a second month:
In this case, the question of what weight to assign to the October mean makes a significant difference to the MoMM. The naive MoMM that ignores the monthly completeness factors gives a value over five degrees Celsius lower than the simple mean, whereas the MoMM that incorporates CFs gives a more defendable value equal to the simple mean:

For a seasonally unbiased dataset, meaning one that covers an integer number of years, especially if it covers all months equally or if it extends over many years, the MoMM value will take on a value very close to the simple mean, as in this 40-year time series of temperature from an ERA-5 reanalysis dataset:
See also