
| Mean of Monthly Means Table | |
This table shows, for the data column you select, the intermediate values that go into the calculation of the mean of monthly means. You can create it on the Tables window of Windographer's main window.
The example below shows temperature data for a seasonally biased dataset covering two winters and one summer. The MoMM values (highlighed in green and yellow) give a significantly warmer average temperature than the winter-biased simple mean, and a better estimate of the long-term mean:
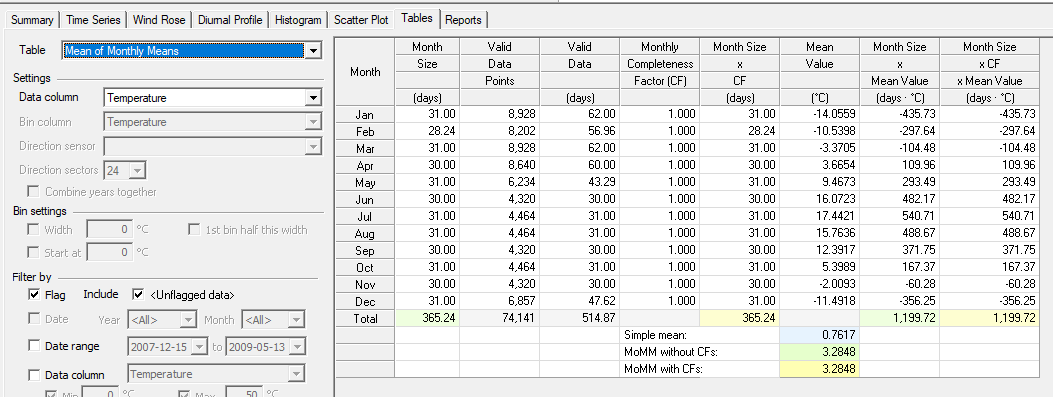
The help artice on the mean of monthly means gives a detailed explanation of the calculation.
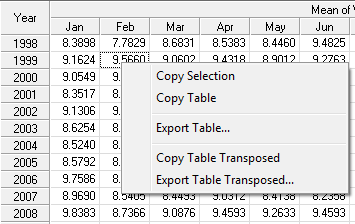
Right click on this or any other table to export it to a text file or to copy it to the clipboard:
See also