| Data Coverage Chart |
 |
A data coverage chart is a diagram showing the presence or absence of valid data in each time step.
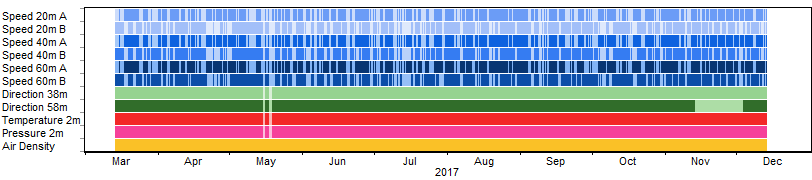
The example above shows:
-
the anemometers reporting frequent short outages, often the A or B anemometer, but rarely both at once (a pattern typical of tower shading)
-
an outage in the 'Direction 58m' variable in late November and early December of 2017
-
two brief outages in mid-May 2017 in all data columns except 'Air Density'
See also
Data Coverage window
Written by: Tom Lambert
Contact: windographer.support@ul.com
Last modified: November 6, 2017