| Boxplot Window |  |
The Boxplot window draws a boxplot of any data column, where each box represents the distribution of that data column's values in a month. You can choose whether to combine months together, in which case you see twelve boxes, one for all January data, one for all February data, and so on, or to plot one box per month of the dataset, in which case you will see 18 boxes for a dataset covering 18 months.

Use the controls in the Filter by section of the window to focus on some subset of the available data. For more information see the article on filtering data.
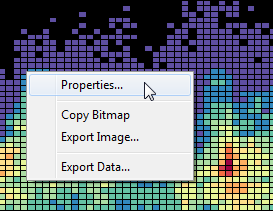
Right-click any graph to change its properties, copy the image to the clipboard, or export it to a file.

See also