
| Annual Statistics Table | |
The Annual Statistics table is one of the tables you can create on the Tables window of Windographer's main window.
This table shows for each year of the dataset, for the data column you have selected:
For wind speed data columns it also shows the best-fit Weibull parameters and the mean of monthly means.
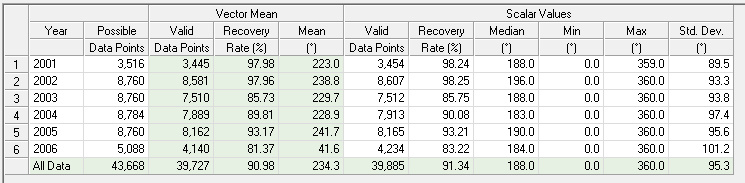
For wind direction data columns, Windographer calculates the vector means for each year, and the other statistics are scalar calculated values as clarified in the table. Note that there could be fewer data points in the vector mean calculation than in the scalar calculations because a valid wind speed measurement is required.
For example, in the dataset shown below, in 2001 there are 3,445 data points that contain both wind direction data and the associated wind speed data. (You can specify the associated wind speed data column from the Configure Dataset window, or specify '<None>' for unit vectors.) But when you look at only the direction data to calculate the mean, min, max and Std. Dev, there are 5,454 valid data points.
The Filter by section allows you to filter for a particular for a subset of your data. For more information see the article on filtering data.
Tip: The start and stop date of the dataset affect the number of possible data points in the first and last year of the dataset. If a five-year dataset ends with March, for example, its number of data points in that year will equate to only a quarter of the total number of time steps in that year. As a result, that year could show a 100% data recover rate, although it only contains three months of data.
This Annual Statistics Table also appears in the Data Column Report, which you can create on the Reports tab.
Annual information is also shown in a different format in the Statistics by Year and Month table
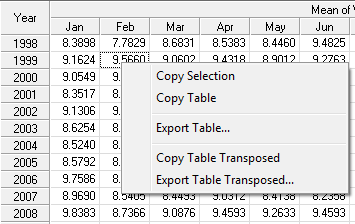
Use the Export Table button to export the table to a text file, or right click on the table to export it or to copy its contents to the clipboard:
See also