
| Dataset Summary Table | |
The Dataset Summary table is one of the tables you can create in the Tables window. It contains the following information.
| Variable | Description |
|---|---|
| Latitude | You enter the latitude on the Dataset tab of the Configure Dataset window. |
| Longitude | You enter the longitude on the Dataset tab of the Configure Dataset window. |
| Elevation | Altitude above sea level. You enter the elevation on the Dataset tab of the Configure Dataset window. |
| Start date | The time of the beginning of the first time step. |
| End date | The time of the end of the last time step. |
| Duration | The time interval between the start date and the end date. |
| Length of time step | The time interval between the start and end of each time step. |
| Calm threshold | The threshold wind speed for inclusion in a wind rose. |
| MoMM temperature | The mean of monthly mean air temperature over the entire dataset. |
| MoMM pressure | The mean of monthly mean air pressure over the entire dataset. |
| MoMM air density | The mean of monthly mean air density over the entire dataset. |
| Power density at 50m | The mean wind power density at 50m above ground. |
| Wind power class | The class into which falls the wind power density at 50m. |
| Power law exponent | A measure of the overall wind shear. |
| Surface roughness | A measure of the overall wind shear. |
| Roughness class | The class into which falls the surface roughness. |
The same information appears in the Summary Report.
The Filter by section allows you to create a tabular report for a subset of your data. For more information see the article on filtering data.
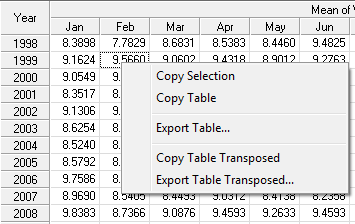
Use the Export Table button to export the table to a text file. Windographer will prompt you to supply the file name and location. You can also right click on the table to export it to a text file or to copy it to the clipboard:
See also