| Statistics by Bin Table |  |
The Statistics by Bin table is one of the tables you can create on the Tables window of Windographer's main window.
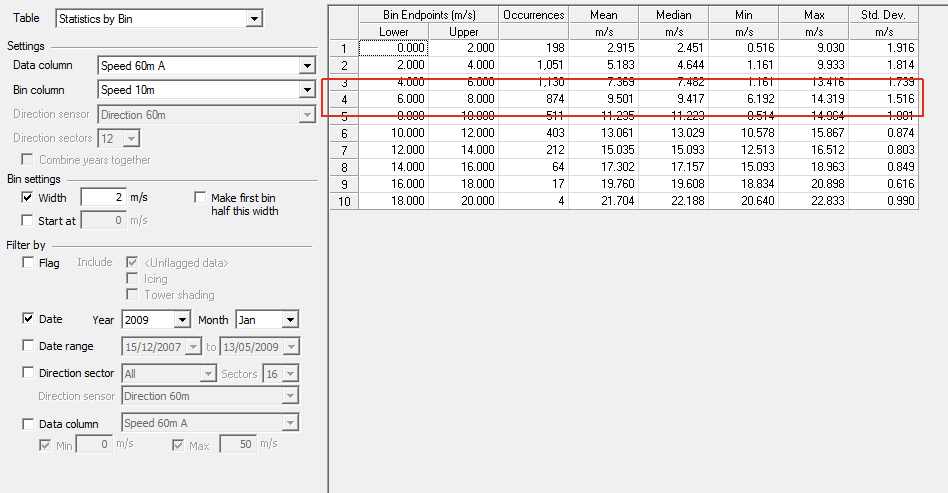
In the Statistics by Bin table, Windographer shows the statistical characteristics of one data column versus bins defined by a second data column. The example below shows the statistical characteristics of the 'Speed 60m A' data column versus bins defined by the 'Speed 10m' data column.
The highlighted row shows that the dataset contains 874 time steps in which the 'Speed 10m' column falls between 6 m/s and 8 m/s in January of 2009, and that within those 874 time steps, the 'Speed 60m A' column has a mean value of 9.501, a median value of 9.417, a minimum value of 6.192, a maximum value of 14.319, and a standard deviation of 1.516.

You can select the data column, bin column, and adjust the bin size controls in the Settings area on the top left hand side of the tab. Wind Direction data columns are not included in the Bin column drop-down box. If you want to see statistics by direction, please use the Directional Statistics table.
A Statistics by Bin table can be created for a subset of the data using the Filter by section. For more information see the article on filtering data.
Tip: The Histogram window allows you to create frequency-by-bin and occurrences-by-bin tables and graphs.
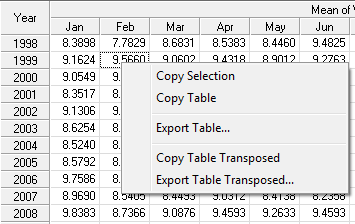
Use the Export Table button to export the table to a text file. Windographer will prompt you to supply the file name and location. You can also right click on the table to export it to a text file or to copy it to the clipboard:

See also