
| Statistics by Hour of Year Tables | |
Five closely-related tables make up the 'Statistics by Hour Year' family of tables. In each of the five tables, Windographer shows a statistical measure of one data column for each hour of the day and each day of the year. This table will have 8760 rows of data (hours per year). The five statistical measures corresponding to the five tables are: number of occurrences, mean, minimum, maximum, and standard deviation. A cell appears blank if the selected data column contains no data that meet your filter criteria for that day and hour.
You can create these tables on the Tables window of Windographer's main window. Use the controls in the Filter by section of the window to focus on a particular subset of you data. For more information see the article on filtering data.
If the data spans more than one year, this table will combine days. For example, statistics for March 3 from 13:00-14:00 might include data from March 3, 2015, March 3, 2016 and March 3, 2017. By viewing the Occurrences table you will be able to determine how many datapoints are included in that cell.
This table places any February 29 data into February 28.
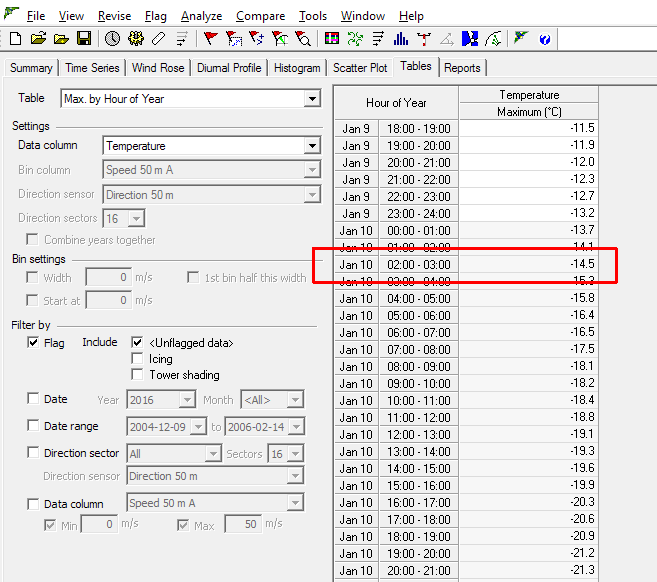
In the sample max. table below, the highlighted cell indicates that on Januray 10 in the 02:00 to 03:00 hour, the maximum Temperature value was -14.5. Note that Windographer calculates these statistics from the data column you select, and not from any associated data column. So this maximum value, for instance, is the maximum value reported in this day an hour by the Temperature data column, not by its associated maximum data column.
The Statistics by Day of Year and Hour of Day tables show the same statistics but in a 365x24 table.
Right click on a table and choose to export it to a text file. Windographer will prompt you to supply the file name and location. You can also copy it to the clipboard and transpose it.
See also
Statistics by Year and Month table
Statistics by Month and Hour of Day tables
Statistics by Day of Year and Hour of Day tables