
| Wind Turbine Output Window | |
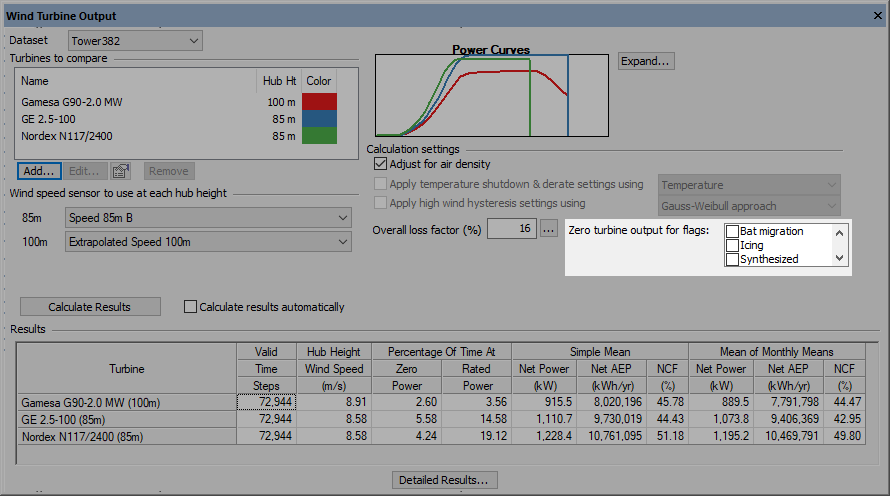
This window allows you to estimate the energy production of a wind turbine in the measured wind regime. To access it, choose from the menu or click the corresponding toolbar button.
You can compare the performance of multiple different turbine models in this window, or you can simulate just one turbine. In its calculations, Windographer takes into account the effects of varying air density, as well as temperature shutdown and derating and high wind hysteresis if the turbine properties specify the relevant attributes. You can also enter various loss factors to account for losses due to downtime, icing, interference from other wind turbines, and so on.
Tip: For a more accurate estimate of wind turbine output, use flagging to clean up any problems in your dataset before using the Wind Turbine Output window.
Click Add to add a turbine to the comparison. The window that pops up displays a drop-down box containing a list of any turbine groups you have defined in the Wind Turbine Library window. The second drop-down box contains a list of the wind turbine models in the turbine group you have chosen. The properties button to the right of this drop-down box shows the complete properties of the turbine. You must specify the turbine's hub height, either by choosing from its standard hub heights or by specifying a custom hub height:

When you have added one or more turbine models to the comparison, Windographer displays the list of turbines and shows a small graph of their power curves. Click Expand to see a full-size graph:

Click Edit to change a turbine's model or color or hub height, or Remove to remove it from the list.
For every hub height represented in the turbine list, Windographer allows you to select which wind speed sensor you would like to use for the turbine output calculations. If your dataset contains multiple wind speed sensors at a hub height, you must identify the one to which you want Windographer to refer. In the example we saw above, the user must specify the wind speed sensors to use to determine wind speed at 85m and 100m hub heights:

By default, the power output calculations will take into account the air density in every time step, but you can uncheck the Adjust for air density checkbox if you wish to turn off that feature. If you uncheck that checkbox, then Windographer will assume a constant air density equal to the rated air density of the turbine power curve. If the turbine properties comprise multiple power curves at different rated air densities, Windographer will use the one nearest to standard air density, which is 1.225 kg/m3. You may wish to turn off air density adjustment in specific cases, such as if you are supplying density-adjusted wind speeds, in which case you would not want the density adjustment performed twice.
If you check this option, and you are modeling a turbine that has derating settings or temperature shutdown settings specified, then Windographer will account for those properties of the turbine in its calculations. For example, it will shut down the turbine if the temperature exceeds the turbine's high-temperature cut-out, or drops below the turbine's low-temperature cut-out.
If you check this option, and you are modeling a turbine that has high wind hysteresis settings specified, then Windographer will account for those properties of the turbine in its calculations. It will shut down the turbine if the wind speed exceeds any of the turbine's high-wind cut-out conditions, and not restart the turbine until the wind speed satisfies all of the turbine's cut-back-in conditions.
You can choose among three approaches to the high wind hysteresis calculations:
Enter a single overall loss factor in the edit box, or click the adjacent button to open the loss calculator window where you can enter up to seven separate loss terms, which Windographer combines in a multiplicative fashion into the overall loss factor.
In some cases you may want to assume the wind turbine does not or cannot operate under certain conditions of shear, veer, or turbulence, or perhaps due to noise restrictions, environmental constraints, grid limitations, or some other reason. You can use Windographer's flag mechanism to model such situations. If your turbines must cease operation during conditions favorable to bat migration, for example, you could apply a flag called 'Bat migration' to the hub height wind speed sensor during those conditions, and then indicate that the turbine output must be zero when that flag applies:
Windographer uses default flag filtering in its turbine power output calculations. That means it will accept as valid any wind speed value that is not flagged with a default-excluded flag. In a time step in which the hub height wind speed value is missing or flagged with a default-excluded flag, Windographer will not calculate the output of the wind turbine, and the statistical results will not incorporate that time step. For instance, if two days of January wind speeds are missing or flagged with an excluded flag, then the mean January power output will be calculated from only 29 days of data.
The only exception is the set of flags that you have checked in the 'Zero turbine output' checkboxes. Windographer will include in its analysis time steps in which the hub height wind speed is flagged with any of those flags, regardless of the flag properties, but it will set the wind turbine output to zero in those time steps.
Windographer assumes constant losses - that is, they will be evenly distributed to every time step. While this might accurately represent how electrical losses occur, it does not accurately simulate any temporary or time-dependent losses such as a 3-day shutdown, seasonal curtailment, or weather-related losses such as icing.
By default, Windographer will only update the calculations in this window when you click Calculate Results. If you want the calculations to update whenever you change a setting, check the Calculate results automatically checkbox.
Windographer estimates the power output of each selected wind turbine in each time step of the dataset, accounting for the hub height wind speed and the power curve of the wind turbine. It also optionally accounts for the effects of air density, derating for temperature and elevation, extreme temperature shutdown, and high wind hysteresis. The article on calculating the energy output of a wind turbine explains in detail.
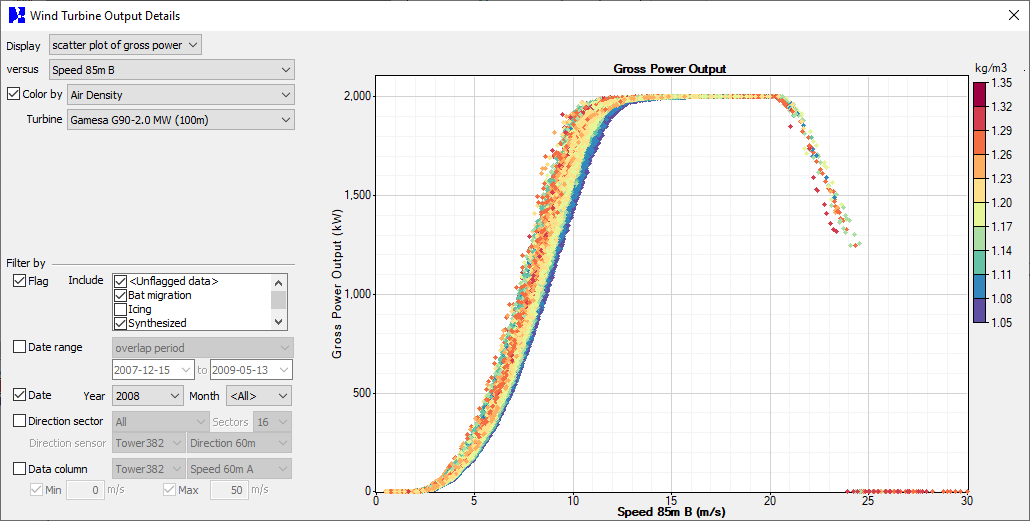
The results of the calculations appear in a summary table at the bottom of the window. You can click Detailed Results to see many more tabular and graphical summaries of the results and to filter the results in all the standard ways:
The article on calculating the energy output of a wind turbine explains the calculations involved, and the table below defines the terms that appear in the graphs and tables:
| Term | Meaning |
|---|---|
| Simple mean | the average of all values |
| MoMM | the mean of monthly means |
| Gross | before accounting for losses |
| Net | after accounting for losses |
| AEP | annual energy production [kWh/yr] |
| NCF | net capacity factor [%] |
| Net energy | total amount of energy generated over the simulated period [kWh] |
| Proportion of net energy | proportion of total net energy produced in some subset of the simulated period [%] |
| Time at zero power | proportion of time the turbine produces negligible power |
| Time at rated power | proportion of time the turbine produces at or above its rated power |
The Format buttons allow you to view some results in either graphical or tabular format. Right-click any table or graph to export the data or the image.
This feature is coming soon to Windographer 5.
After calculating results, click Add Time Series to Dataset to add to your dataset a data column containing the gross turbine power output for the currently selected turbine. You can then visualize, analyze, modify, or export that data column just like any other data column.
See also
Calculating the energy output of a wind turbine
Wind Turbine Properties window