
| Density-Adjusted Wind Speed | |
In the Configure Dataset window you can instruct Windographer to calculate a new column which adjusts a given wind speed column to the equivalent wind speed at a specific air density. Windographer uses the calculated air density column and the provided wind speed in every in every time step of the dataset, and adds that time series to the dataset as a calculated data column.
This is often used to in conjuction with a wind turbine power curve provided at the same density.
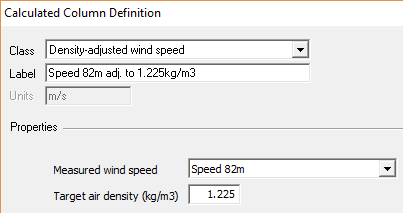
As an example, imagine that you have wind speed data and measured power output from a wind turbine, whose manufacturer has provided a power curve rated at 1.225 kg/m³. A turbine will typically produce a different power output from a 10 m/s wind at an air density of 1.08 kg/m3 versus the same wind speed at a density of 1.20 kg/m3. Therefore, a scatterplot of power vs. speed will probably match the manufacturer's power curve more closely if you plot versus speeds adjusted to a density of 1.225 kg/m3, rather than versus actual measured speeds. You might define that density-adjusted speed column using settings like those shown below:
Windographer calculates the density-adjusted wind speed using the following equation:
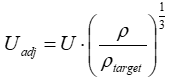
where: | ||
| U | is the actual wind speed recorded in the current time step [m/s] | |
| r | is the actual air density in the current time step [kg/m³] | |
| rtarget | is the target air density [kg/m³] |
Tip: In the Wind Turbine Output window, Windographer will take wind speed, air density and a wind turbine power curve, use a similar formula, and calculate the expected power output.
Note that the calculated data column will have no data when the original data column is missing or flagged to exclude from calculations. Default flag filtering applies.
See also