
| Pattern-Based Reconstruction Mechanism | |
Wind resource datasets usually contain speed, direction, and often temperature measurements made at multiple heights above ground. For each of these variables, measurements made at one height tend to correlate strongly with measurements made at another height. In many cases multiple sensors may be installed at the same (or nearly the same) height, such as duplicate anemometers installed at each measurement height on a met tower to ensure that at least one is always free of tower shadow effects. Such nearby sensors also tend to correlate very strongly with each other.
Windographer's pattern-based reconstruction mechanism aims to make use of these strong internal correlations to reconstruct missing or invalid measurements in one data column using as reference one or more valid measurements in other data columns of the same type.
This mechanism aims to generate synthetic data for every speed, speed SD, direction, and temperature data point that is missing or flagged to exclude. Whether it succeeds at filling all those data points depends on the existence of other data columns of the same type and the data availability of those source data columns.
The mechanism consists of two steps. In the first step it reconstructs data from colocated sensors, meaning sensors at the same type installed at the same (or nearly the same) measurement height. In the second step, it reconstructs data from sensors at the same type installed at different measurement heights.
To reconstruct a missing speed or speed SD value, if the dataset contains one colocated data column of the same type, and if that colocated sensor contains valid data in this time step, this mechanism generates a synthetic value using a TLS regression equation calculated between the two colocated data columns in each of 72 direction sectors. (To define sectors, it uses the direction sensor nearest in height to the target data column.) The graphs below show typical directional patterns in slope and offset caused by tower shading in met towers.
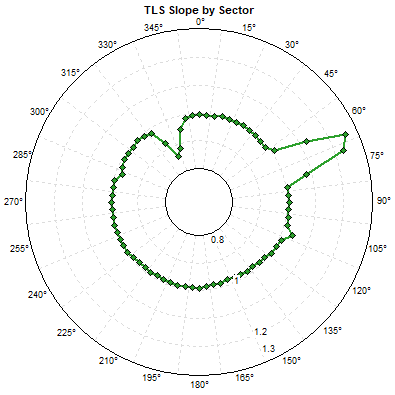
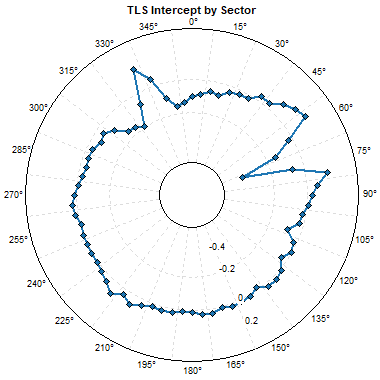
The TLS-regression-by-sector approach described above occurs only in the case of exactly two colocated speed or speed SD columns. If the dataset contains three or more colocated speed or speed SD columns, then to fill a gap in one of them, Windographer simply calculates the mean of the valid values in the others.
To reconstruct a missing temperature value, this mechanism simply calculates the average of the valid temperature values in any colocated data columns of the same type. It does the same to reconstruct a missing direction value, except that it calculates the vector mean direction assuming unit vectors.
If the dataset contains data columns of the same type at other heights, then the mechanism builds a 365 x 24 lookup table of the shear parameter by day of year and hour of day. It uses windowing in both day of year and hour of day as necessary, so that if the dataset contains no August data for example, the 'window' of data used to calculate the August cells of the lookup table will expand to take in data from July and September. Each cell of the lookup table takes in data from all years of the dataset, so that if the dataset is seven years long, for example, the February 14th cells of the table will incorporate data from all seven Valentine's days in the period of record. Further explanation of this process appears in the article on the seasonality profile.
In every cell of this 365 x 24 lookup table, Windographer calculates the mean (or in the case of direction data, the vector mean) value of each visible data column in the dataset, in the appropriate time of day and day of the year, requiring concurrency across those data columns, and using default flag filtering. It then finds, for the resulting set of values, the best-fit parameter of the appropriate shear model. The following table shows the shear model appropriate for each data type.
| Data Type | Shear Model |
|---|---|
| Speed | Power law or log law, depending on the user's choice in the Options window |
| Speed SD | Power law |
| Direction | Linear change with height |
| Temperature | Linear change with height |
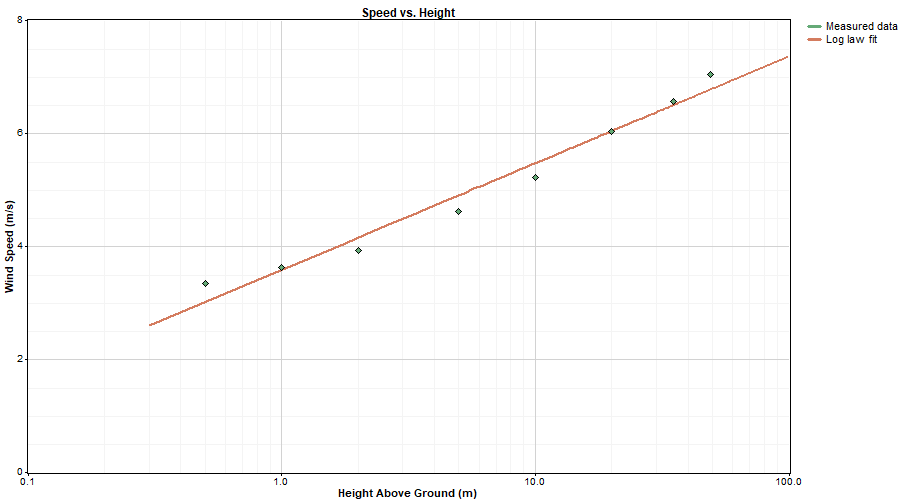
The graph below shows an example of a log law fit to values of speed vs. height. As described in the article on surface roughness, Windographer finds the line of best fit by performing a linear least squares regression on the speed versus the logarithm of height.
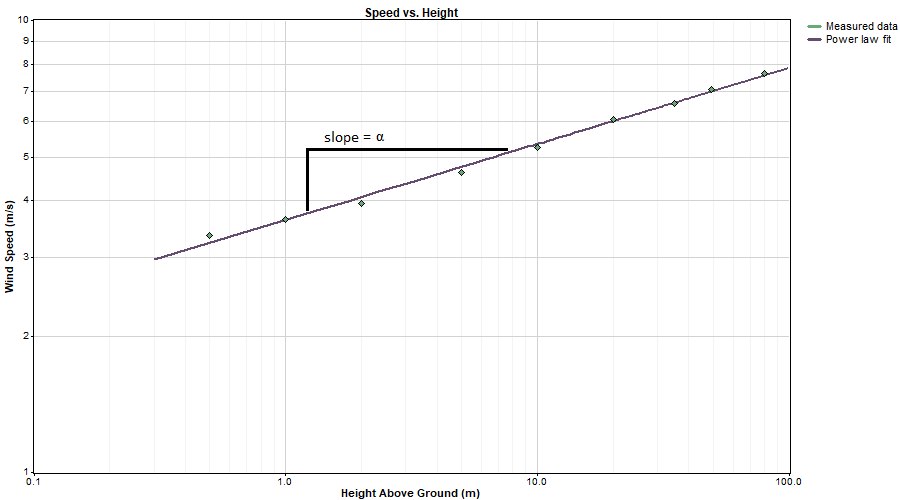
The graph below shows an example of a power law fit to values of speed vs. height. As described in the article on power law exponent, Windographer finds the line of best fit by performing a linear least squares regression on the logarithm of speed versus the logarithm of height.
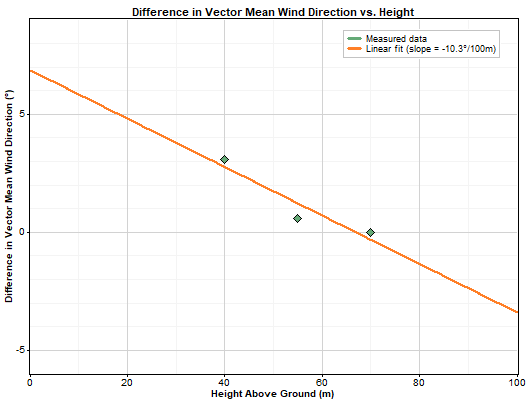
The calculation of veer requires extra logic to account for the vector nature of direction data. In each cell of the 365 x 24 lookup table of wind veer, Windographer calculates the vector mean directions of all visible direction sensors, using the speed sensor associated with the top direction sensor. It then treats the top direction sensor as the 'anchor' and calculates the difference between each vector mean direction and that anchor direction, where positive indicates clockwise from the anchor. This calculation of the difference takes into account the 360° wrap-around nature of direction data so that, for example, the difference between 355° and 5° is 10°. It then performs a linear least squares regression on those values of difference in vector mean direction versus height, as the graph below shows.
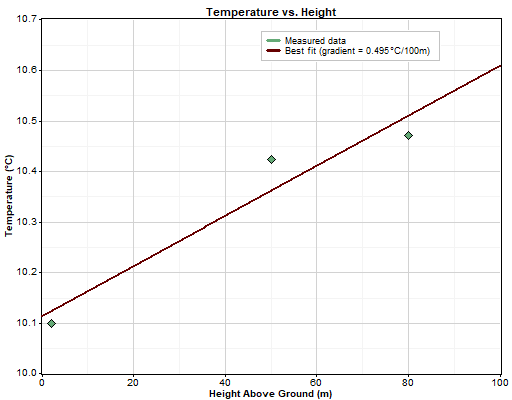
The graph below shows an example of a linear least squares fit to the values of temperature vs. height. Windographer performs this process for each cell of the 365 x 24 lookup table of temperature gradient.
Having constructed each of these lookup tables, the pattern-based reconstruction mechanism can then reconstruct a missing value of speed, speed SD, direction, or temperature in a time step in which at least one other sensor of the same type reports a valid value. It does this by searching for the nearest (in height) data column that contains valid data, and then synthesizing a value using:
In the case of wind speed standard deviation data, the pattern-based reconstruction mechanism performs one additional step. For the anchor wind speed column, it uses all valid observed values of speed and speed SD to generate a three-dimensional lookup table of turbulence intensity (TI) versus hour of day, day of year, and wind speed. Then for every time step that contains a valid speed value but no speed SD value, and no valid speed SD observations at any other height, it synthesizes a TI value using that lookup table, and multiplies by the speed to find the estimated speed SD value.
This technique allows the reconstruction process to synthesize reasonable turbulence and speed SD data for time steps in which the MCP-based reconstruction process may have generated synthetic speed values, regardless of whether the MCP reference dataset contained turbulence data.
In the case of reconstructing a one-year met tower dataset using a ten-year reanalysis dataset as reference, for example, the MCP-based mechanism would reconstruct nine years of the met tower's anchor anemometer speed values, then the turbulence lookup table would synthesize nine years of corresponding speed SD values using the met tower's observed turbulence patterns, then the shear-based reconstruction process would synthesize speed and speed SD values at every other measurement height using the met tower's observed shear patterns. The nine years of synthetic data should therefore faithfully reflect the reference dataset's patterns in those nine years, to the appropriate degree of correlation, and it should also display the same shear and turbulence patterns as the one-year met tower data displays.
The pattern-based reconstruction mechanism forms part of the process of reconstruction across datasets, which happens in the Reconstruct Across Datasets window. It also forms part of the process of reconstruction within a dataset, which happens in the Reconstruct Single Dataset window.
See also
Reconstruct Single Dataset window
Reconstruct Across Datasets window