
| Reconstruct Single Dataset Window | |
The Reconstruct Single Dataset window allows you to fill some or all of a dataset's gaps with synthetic data. Access this window by choosing from the menu.
Tip: Filling gaps is optional. Windographer can display data and perform calculations regardless of how many gaps a dataset contains.
This window fills gaps using the process of reconstruction within a dataset. As the article on that process explains, it uses pattern-based reconstruction and, optionally, Markov-based reconstruction as well. The pattern-based mechanism generates synthetic values that track with the valid measured data, whereas the Markov-based mechanism generates entirely artificial data segments that may deviate significantly from what actually happened in that time interval despite their realistic statistical properties.
In the example below, one day at the end of March 2021 contains no valid measurements, so pattern-based reconstruction cannot fill that gap. In several days at the beginning of April one of the four speed sensors reports valid data so Windographer can use the pattern-based mechanism to reconstruct the mean speed and standard deviation of speed values using data from the valid 50m A sensor, along with the wind shear patterns it measures elsewhere in the dataset.
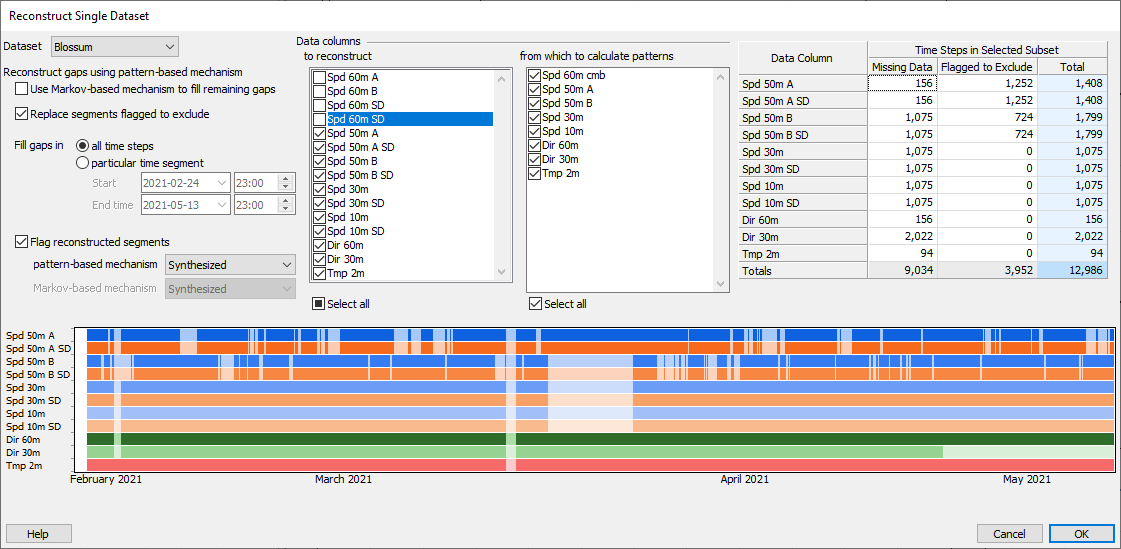
If you choose to employ both reconstruction mechanisms, Windographer will use the pattern-based mechanism to reconstruct all that it can, then employ the Markov-based mechanism to fill the remaining gaps. Further details appear in the article on the process of reconstruction within a dataset.
If you check the option to Replace segments flagged to exclude then Windographer will reconstruct not just missing data segments, but also those that you have flagged to exclude.
To all reconstructed data segments Windographer can apply the flag of your choice. If you choose to apply Markov reconstruction, you can choose to apply a different flag to Markov-generated segments. The flag drop-down boxes will contain all default-included flags in the dataset.
At the bottom of this window appears a data coverage chart that shows the positions of gaps in each data column. You can expand this chart by expanding the window, which could show more small gaps due to better resolution. The Data Coverage window is another place to view data on a data coverage chart.
Tip: Only visible data columns will appear in the data coverage chart, but all static columns will appear in the list of data columns to reconstruct. Reconstruction does not apply to calculated columns because they update automatically to reflect reconstruction (or any other change) in their source data columns.
See also
Process of reconstruction within a dataset
Reconstruct Across Datasets window