
| Correlate Speed Tab | |
This tab of the Long Term Adjustments window lets you choose the algorithms (and their settings) that you wish to consider for correlating the wind speed data in the current long-term adjustment. You do not have to consider multiple algorithms and settings each time you perform an MCP analysis; you can use the same algorithm and the same settings in every case if you wish. But this tab gives you the option to determine experimentally the algorithm and settings that works best in each situation. The table below briefly describes each type of algorithm, and provides links to more detailed explanations.
| Algorithm Type | Abbrev. | Description |
|---|---|---|
| Linear Least Squares | LLS | The classic least squares fit to the scatter plot of target and reference speeds |
| Total Least Squares | TLS | A slight modification of LLS that minimizes orthogonal distance to line of best fit |
| Variance Ratio | VR | A simple linear mapping that aims to preserve the variance of the target data |
| Bulk Speed Ratio | BSR | The simplest possible algorithm, based on the ratio of mean wind speeds |
| Weibull Fit | WBL | A power law fit whose parameters derive from the Weibull parameters of the target and reference data |
| SpeedSort | SS | A linear fit to the relationship between target and reference cumulative frequency distributions |
| Vertical Slice | VS | A piecewise linear fit to the scatter plot of target and reference speeds |
| Matrix Time Series | MTS | An implementation of the classic matrix method that we modified to produce realistic time series data |
The list box on the left side of the window shows the algorithms that you have chosen to consider. Click Add or Remove to modify the list, or use the up and down buttons to adjust the order. When you select an algorithm from this list, the right side of the window will show that algorithm's settings and some preliminary results of applying that algorithm to the current target and reference datasets. As you change the settings, those preliminary results will update accordingly.
Click Test Algorithm Performance to perform a cross-validation test in the Algorithm Performance Test window.
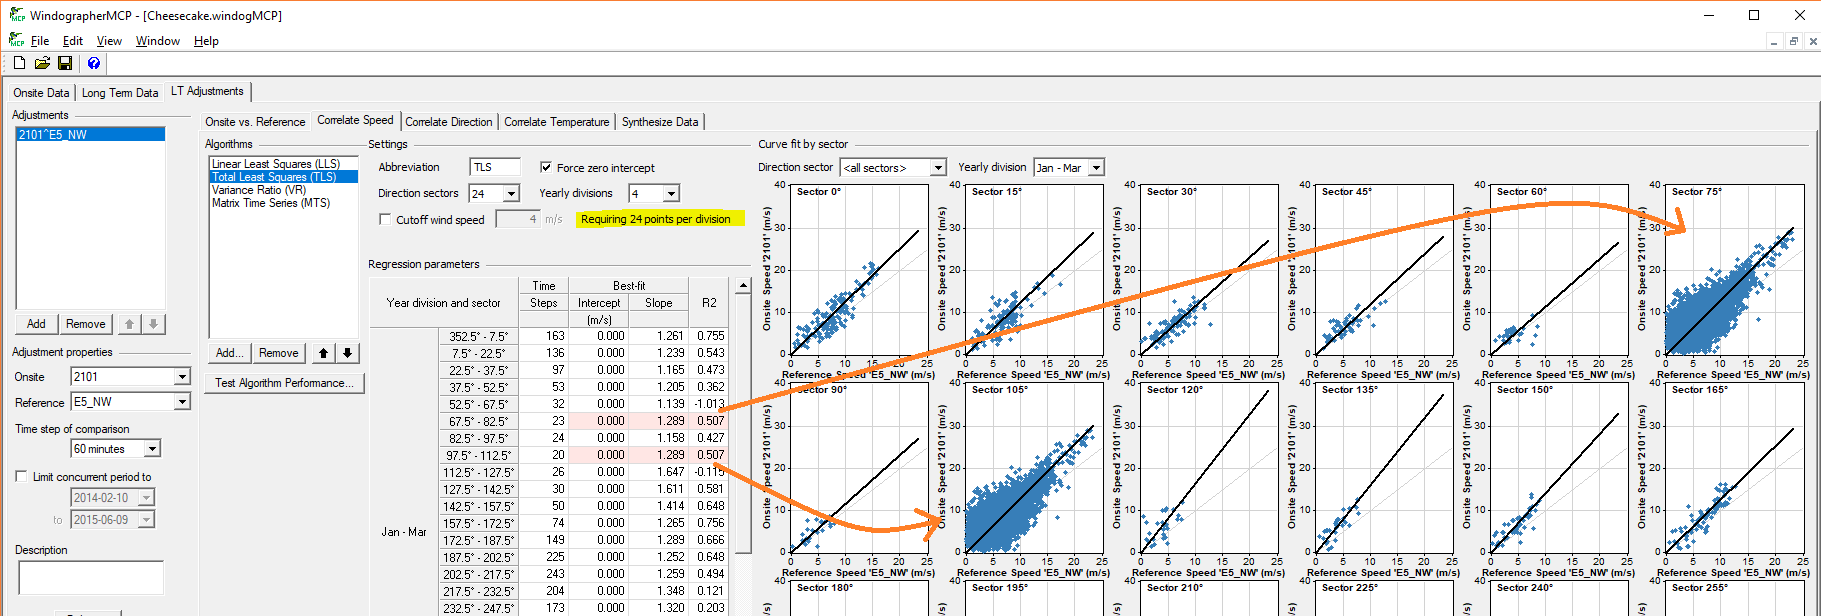
When calculating a regression, Windographer requires at least 24 hours of data in each subdivision, with an absolute minimum of 8 data points. An hourly time step of comparison, as in the screenshot below, results in a minimum 24 time steps. Divisions falling below the required number use the overall regression, meaning the one comprising all sectors and all months of the year. In the screenshot below, two divisions in January fall below the limit, so in those sectors Windographer uses (and plots) the overall regression:
See also