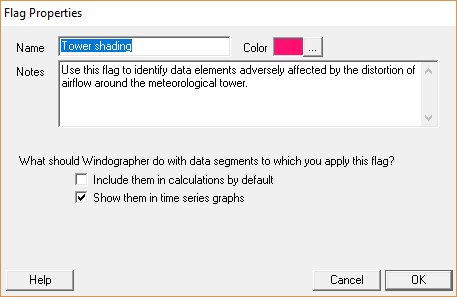
| Flag Properties Window |  |
This window lets you specify the properties of a flag.
Enter a unique name for the flag and select the color that graphs will use to highlight data points flagged with this flag.
The two checkboxes instruct Windographer as to how to handle data flagged with this flag. The checkbox labeled Include them in calculations by default affects default flag filtering. If the flag has a negative connotation, such as icing or tower shading, you should instruct Windographer to exclude segments flagged with that flag. Note that this only affects the default filter settings, and most windows in Windographer let you override the default settings if you wish to do so.

If you choose not to check the first checkbox, then Windographer will enable the second checkbox, labeled Show them in time series graphs. This controls the visibility of data flagged with this flag. If you intend to apply the flag to typical data problems such as icing events, you will likely check this checkbox because you will probably want such data segments to appear in time series graphs even if you do not want to include them in calculations. But if you intend to apply the flag to error codes (e.g. 9999 or -999) that a data logger might record to indicate missing or problem data points, then you might decide not to check this checkbox. Keeping such data points out of time series graphs prevents them from upsetting the scale of the y-axis.
Note that if you edit the properties of a flag that is already applied to data in the current document, Windographer will update all of its calculations and graphs to reflect the new properties of the flag.
See also