
| Probability of Exceedence Window | |
This feature is coming soon to Windographer 5.
The Probability of Exceedence window analyzes the distribution of annual mean values for a particular data column, and uses that to estimate the probability that the annual mean will exceed certain values over long periods of time. This estimate becomes more accurate with more years of data.
You can access this window by choosing from the menu.
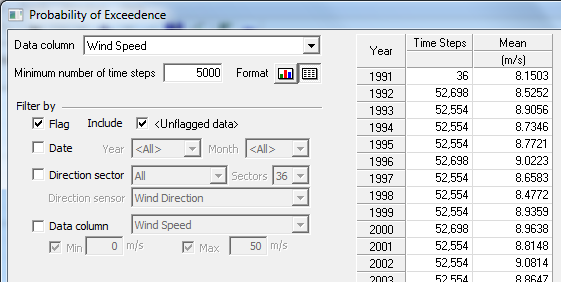
When you make a selection from the Data column drop-down box, Windographer finds the mean value of that data column in each year of the dataset, and puts those annual mean values in the table along with the number of time steps that went into that calculation. To see that table, use the Format buttons to choose tabular format. The other table that appears in that mode shows the probability density function of the annual means. That same data appears in a graph when you switch to graphical format, along with a graph of the probability of exceedence.
Use the edit box labeled Minimum number of time steps to exclude partial years or years with low data recovery. In the example below, by setting the minimum number of time steps to 5000, the user has excluded the year 1991 because it contains only 36 time steps.
The Frequency Histogram graphically displays the frequency with which the annual mean values fall within various bins. The example below shows that the mean wind speed fell between 8.8 m/s and 8.9 m/s in almost 30% of the years in the dataset.

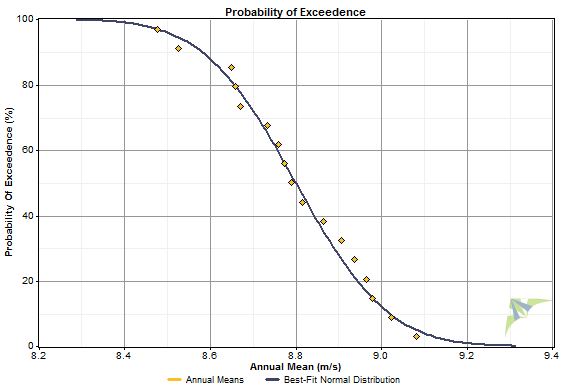
The Probability of Exceedence graph shows both the measured values and the normal distribution that best fits those values. The y-axis indicates the probability that the annual mean value will exceed a particular value. The example below shows data from a 16-year dataset. The measured data points fall close to the best-fit normal distribution, meaning the normal distribution is a good fit to the data in this case. (It may not always fit the data this well.) This graph shows that for any particular year, the probability that the mean annual wind speed will exceed 8.8 m/s is about 50%, and the probability that it will exceed 9.0 m/s is about 12%.
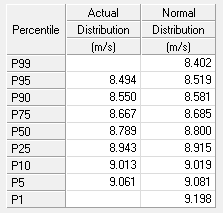
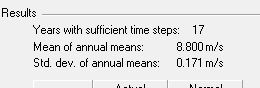
The table in the bottom left corner of the window shows the key percentile values for both the actual distribution and the best-fit normal distribution. The table below shows that, according to the best-fit normal distribution, the P95 value is 8.515 m/s, which means that we would expect the mean annual wind speed to exceed 8.515 m/s in 95 years out of 100.
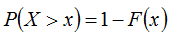
The cumulative distribution function gives the probability that a variable drawn from a certain distribution will be less than or equal to certain value. Therefore, the probability of exceedence of any distribution is one minus its cumulative distribution function:
where: | ||
| P(X>x) | is the probability that a value X drawn randomly from the distribution will exceed x | |
| F(x) | is the cumulative distribution function |
To calculate the cumulative distribution function of the actual distribution (the set of annual mean values), Windographer sorts the N annual mean values into ascending order x1, x2, x3... xN and uses the following equation:
Windographer assumes that the best-fit normal distribution is the one whose mean and standard deviation match the mean and standard deviation of the annual means:
It uses the following equation to calculate the cumulative distribution function for the normal distribution:
where: | ||
| erf() | is the Gauss error function | |
| m | is the mean of the annual means | |
| s | is the standard deviation of the annual means |
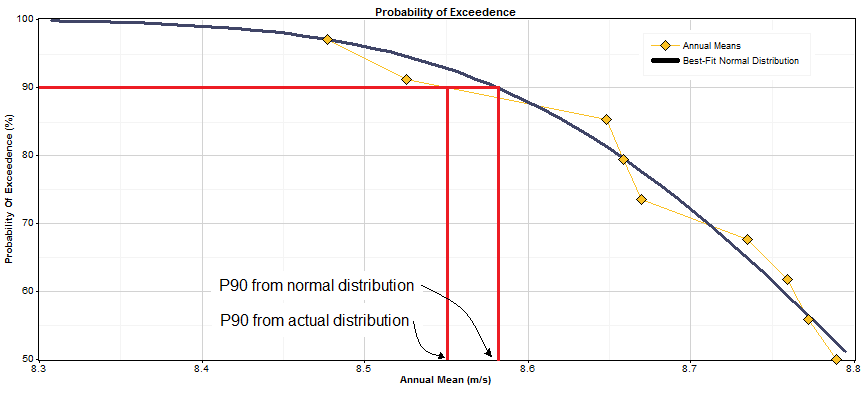
Using the above equations, Windographer constructs piecewise linear functions of the probability of exceedence of the actual distribution and of the best-fit normal distribution. They appear as the yellow diamonds and the black line, respectively, in the Probability of Exceedence graph that appears in the lower part of the window.
To calculate the annual mean value corresponding to a particular probability, Windographer interpolates linearly on those piecewise linear functions. To find the P90 value, for example, it interpolates to find the x value that makes the probability of exceedence equal 90%. We can simulate this process on the probability of exceedence graph. To find the P90 value, draw a horizontal line at 90% POE. The x-value at which that line intersects the actual distribution line is the P90 value of the actual distribution. The x-value at which that 90% line intersects the normal distribution line is the P90 value of the normal distribution. The graph below shows that the P90 value from the actual distribution is about 8.50 m/s, and P90 value from the normal distribution is about 8.58 m/s. Those numbers confirm the P90 values shown in the table above.
Note that Windographer requires many years of data to calculate all the percentiles for the actual distribution. It requires only a few years to fit the normal distrbution though, and from the normal distribution it can calculate any percentile, subject to the uncertainty of extrapolation.
Note: This window differs from the Extreme Wind window. This window analyzes the annual mean values, which tend to conform to a normal distribution. The Extreme Wind window analyzes the annual maximum values, which tend to conform to a Gumbel distribution.
The filter settings controls allow you to focus the analysis on a subset of your data. Windographer does not allow filtering by year or by date range in this window, but you can filter for a specific month, in which case Windographer uses data from only that month for each year in the dataset. Otherwise, it considers data from all months. Please see the article on filtering data for more information.
Right-click any graph to change its properties, copy the image to the clipboard, or export it to a file. Right-click on any table to export it to a file, or copy it. See the article on exporting graphs or exporting tables for more information.
See also
Probability Density Function definition
Cumulative Distribution Function definition