
| Resampling Standard Deviation Columns | |
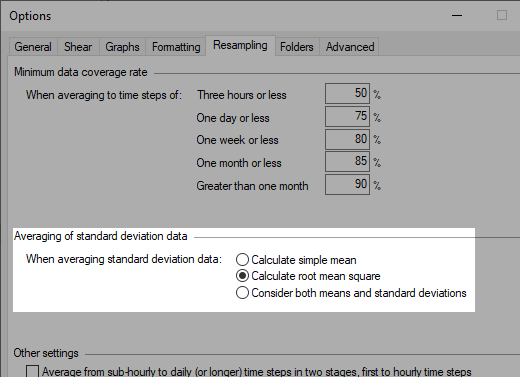
Whenever Windographer resamples data in a way that involves combining time steps, such as when resampling 10-minute data to hourly time steps, it gives special treatment to data columns containing standard deviation data. The Resampling tab of the Options window gives three options for this process:
If you choose the first option, then Windographer calculates the standard deviation of the larger time step as the simple arithmetic mean of standard deviations of the smaller time steps, using the following equation:
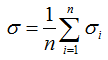
where: | ||
| n | is the number of smaller time steps in the larger time step | |
| si | is the standard deviation in the ith smaller time step | |
| s | is the standard deviation in the larger time step |
If you choose the second option, then Windographer calculates the square root of the mean of the squares of the standard deviations of the smaller time steps, using the following equation:
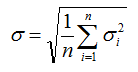
Tip: The SDR software from NRG Systems uses the above equation to calculate 60-minute standard deviation values from 10-minute measurements.
If you choose the third option, Windographer considers both the standard deviations and the means of the smaller time steps, calculating the combined standard deviation using the following equation:
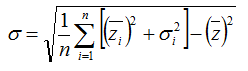
where: | ||
| zi | is the mean value in the ith smaller time step | |
| z | is the mean value over the larger time step |
Note that if you use this method, Windographer will require valid mean and standard deviation data in a given time step in order for it to be included. This may produce unexpected gaps in the data when Windographer applies the minimum data coverage settings.
The rest of this article presents a derivation of the above equation.
In the wind energy industry, data loggers typically take measurements every one or two seconds, and then record the mean, minimum, maximum, and standard deviation of those measurements every ten minutes. To accurately combine these 10-minute values into a larger time interval such as sixty minutes, one must therefore estimate the standard deviation of the combined distribution of measurements. In general, the standard deviation of the 60-minute combined distribution will not equate to the simple mean of the six 10-minute standard deviations.
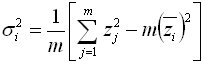
To develop an equation for this combined standard deviation, we need to start with the definition of the standard deviation of the measurements taken in time step i, in which the data logger takes m samples of variable z:
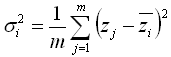
where: | ||
| si | is the standard deviation of the smaller time step data | |
| zj | is one of m measurements | |
| zi | is the mean value of the smaller time step data |
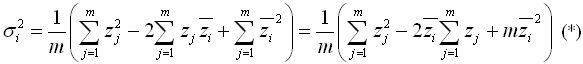
Expanding the squared term gives:
Now note the definition of the mean that we use to calculate zi:
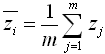
We can rearrange this definition to get:
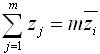
Substituting that into the above equation marked (*) gives:
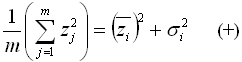
We can simplify this to:
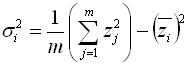
and then rearrange to get:
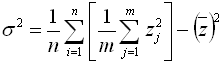
Now, a period of time that comprises n time steps, each of which comprises m samples, comprises a total of N = m*n samples. The standard deviation of that entire set of N samples is given by:
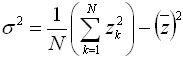
But because we can subdivide those N samples into n groups of m samples, we can re-write that summation to get:
And subsituting in the above equation marked (+), we get:
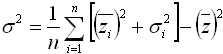
Taking the square root of both sides gives us:
where: | ||
| n | is the number of smaller time steps in the larger time step | |
| zi | is the mean value in the ith smaller time step | |
| si | is the standard deviation in the ith smaller time step | |
| z | is the mean value over the larger time step | |
| s | is the standard deviation in the larger time step |
See also
Turbulence Intensity definition