
HOMER Grid 1.10

The Time Series Plot can be accessed at the bottom of the simulation results pop up as shown below.
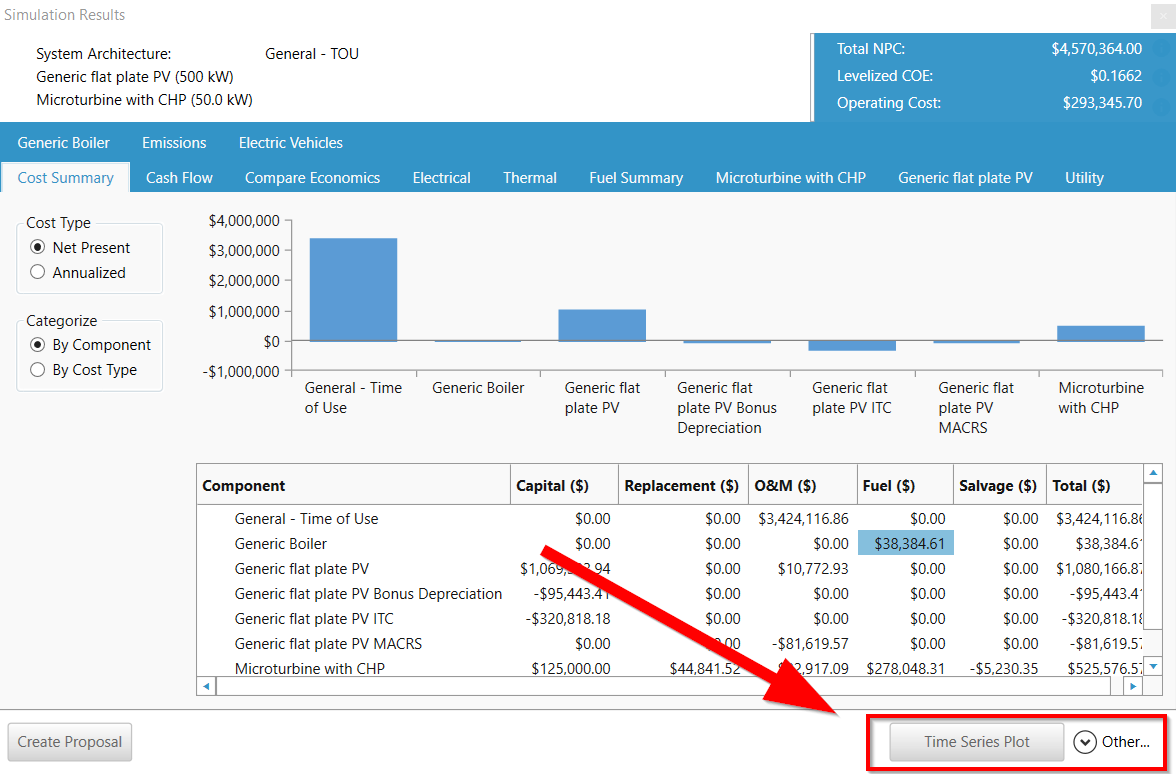
Time Series Plot
The Time Series plot can graph a number of model variables over the duration of the simulation. The granularity is defined by the time-step of your model.
Tab |
Description |
|---|---|
Hourly |
The hourly time series plot lets you view the generation from each component, how it serves the load, the resources that power the components, as well as a number of key operational characteristics from each component for an entire year of your simulation. Results can be plotted in either the top axis or a bottom axis, by clicking the left or right checkbox, respectively. If you have plotted a set of variables in an axis, you can use the Sum and Difference checkboxes to add the variables. For example, the PV power output and diesel genset output can be added together. |
Monthly |
A blue box-and-whisker plot of monthly values for the selected parameter. The top line corresponds to the overall maximum, and the bottom line to the overall minimum. The top of the blue box is the average daily maximum, and the bottom of the blue box is the average daily minimum. The middle line is the overall average. |
Profile |
Shows the hourly performance for an average day for each month for the selected parameter. |
DMap |
A concise way to view an entire year of data for the selected parameter. The x-axis (horizontal) represents the day of the year and the y-axis (vertical) represents the hour of the day. For each time step the DMap displays a corresponding color from legend on the right. |
Histogram |
A bar plot that groups the values from the selected parameter into bins according to their value. It can show you how often the parameter's value falls within each bin. |
CDF |
Cumulative Distribution Function (also called Cumulative Density Function) is the probability that the selected parameter will have a value less than or equal to the value shown on the x-axis (horizontal). It is the integral of a histogram function. |
DC |
Duration Curve is the number of hours that the selected parameter exceeds the value shown on the y-axis (vertical). It shows similar data to the CDF, if you flip the axes. It is also very commonly used in the electric utility industry. |
Hourly
Zoom in and out of specific dates rates with the (+) and (-) buttons.
Click on the various parameters on the right to view them.
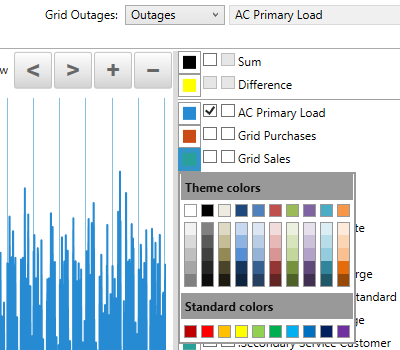
Change the color by clicking on it in the legend.
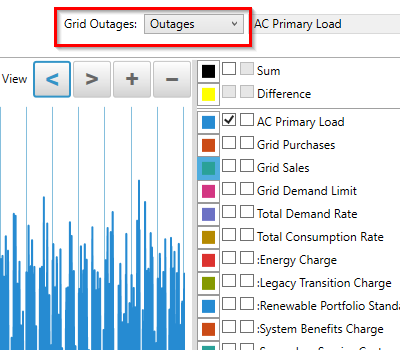
If your model includes an outage, you will be able to select from two different time series in the Time Series view. For resilience, two different time series can be viewed: one year during which a resilience event occurs and one year of normal, no-outage operation.
Other Button
If you'd like to export this information or view it in tabular form, you may do so under the Other options next to the 'Time Series Plot' button within the simulation results.The following options are available by clicking the Other button at the bottom of the Simulation Results window.
Multi-Year
The Multi-Year graph allows you to plot variables over the project lifetime.
Scatter Plot
The Scatterplot graph allows you to plot any variable against any other variable. This kind of graph can often helps you to understand how the system operates. For example, plotting diesel power output versus storage state of charge may reveal that the diesel only operates when the storage is at or near its minimum state of charge.
Delta Plot
The Deltaplot shows the frequency of changes in any variable over some length of time. Choose the variable from the drop-down menu, and choose the length of time using the slider control.
Table
The table displays all of the time series data generated by the simulation for each time step.
Export
The export function exports all time series data from the selected simulation to a CSV file. Choose or enter a location and name for the output file.
Copy
The copy function copies all the data in the simulation results window. You can paste this into a word or excel document.
Dispatch Log
The Dispatch Log selection will allow you to save a single text file containing the Dispatch Log for all time steps.
