HOMER Grid 1.10

Tables Mode
The Tables Mode lets you see results in a table and allows you to see your simulation results.
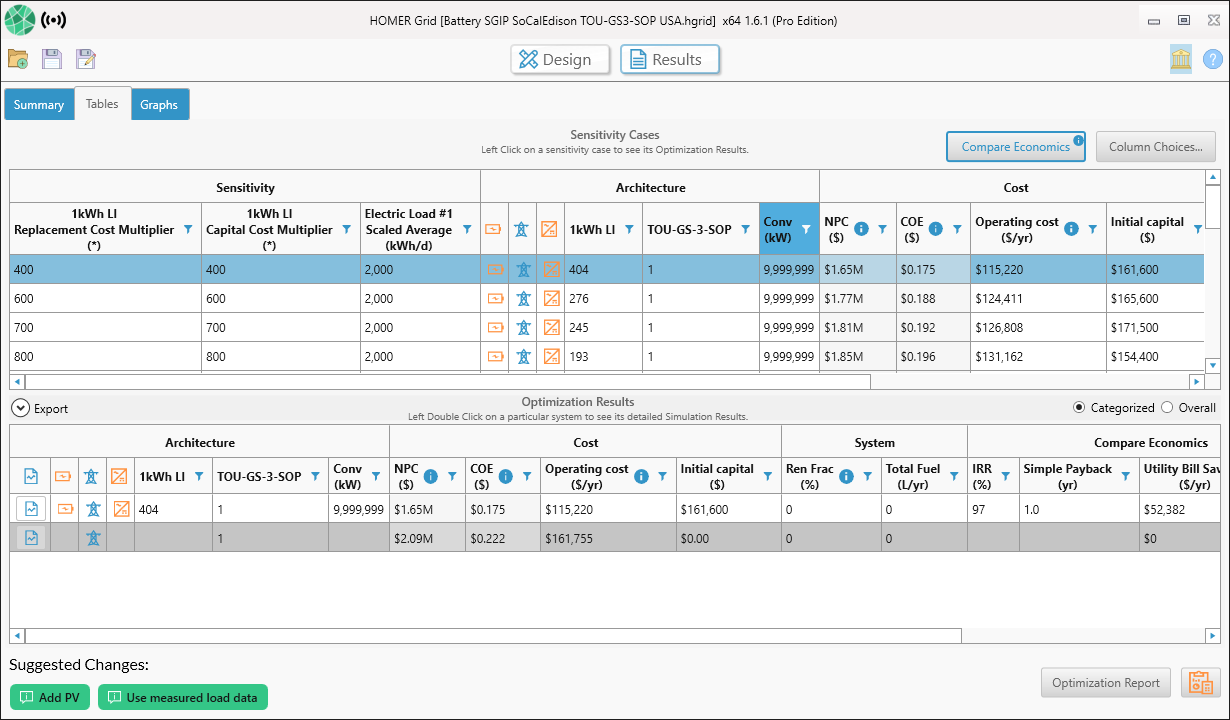
The Tables mode contains two tables: the Sensitivity Cases table and the Optimization Results table. The Sensitivity Cases table shows a list of the best feasible systems for each sensitivity case entered. Click a sensitivity case entry to view all feasible systems for that case in the lower, Optimization Results table.
For each sensitivity case it solves, HOMER simulates every system in the Size your own and ranks all the feasible systems according to increasing Net Present Cost in the Sensitivity Cases table. The Optimization Results table lists all the feasible simulations for a selected sensitivity case. (Non-feasible systems are not shown.)
You can also view Simulation Results in a wide variety of tables and graphs that help you compare configurations and evaluate them on their economic and technical merits. You can export the tables and graphs for use in reports and presentations. Double-click a system in the Optimization Results table (the lower table) to see its details in a Simulation Results window.
Below is a screenshot of the tabular view of the results in HOMER Grid: