
HOMER Grid 1.10

![]()
The Results button appears on the top center of the toolbar, and is visible from all pages. The Results page appears after you click the Results button and HOMER performs its calculations.
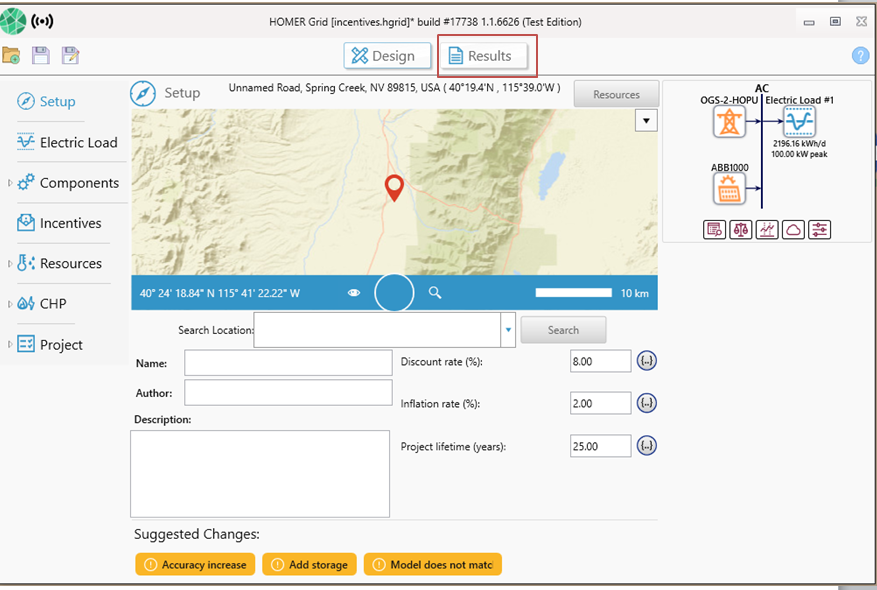
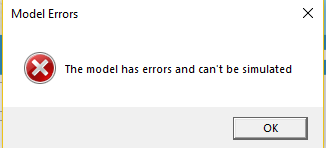
If the current design contains all the necessary components and resources, the results button can be clicked to start calculations. If your model is incomplete, then you would find warnings at the bottom of the screen in red. (shown in the above screen shot). Clicking the Results button when the model is incomplete could give you the following error message:
When you click the Results button, HOMER performs the calculation and displays the results on the Results page.
You can view your results in three modes: Summary, Tables or Graphs. You can switch between the three modes, by selecting the tab on the left side of the screen. The tabs are highlighted in the red box in the image below:

Summary Mode
The purpose of the summary mode is to give you an overview of the winning system (system with lowest Net Present Cost) and the economic metrics in comparison to the base system (system with lowest capital cost). If you would like to see the results in tabular format, then click on the Tables tab.
There are three possible summary types. To view more detailed information about each summary result, click one of the links below.
•Summary with a base case and a winning case
•Summary when a utility only system wins or if the base case is the winning system
•Summary when there are no feasible solutions
Tables Mode
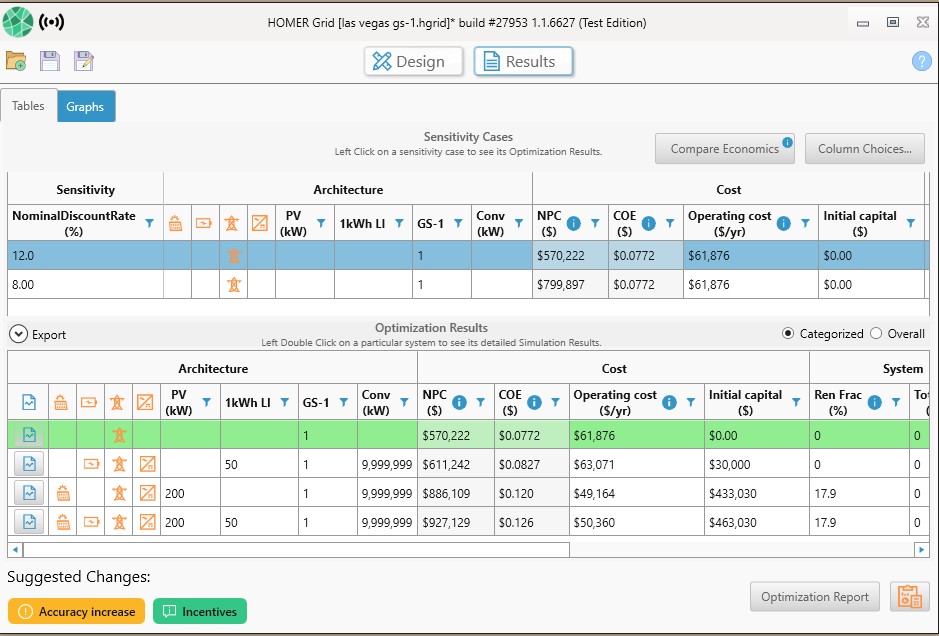
The default, Tables mode, contains two tables, the Sensitivity Cases table and the Optimization Results table. The Sensitivity Cases table shows a list of the best feasible systems for each sensitivity case entered. Click a sensitivity case entry to view all feasible systems for that case in the lower, Optimization Results table.
After HOMER calculates the information you selected and entered for your system options, you can view the feasible configurations of components on the Results page. The Sensitivity Cases table shows the system with the lowest net present cost for each sensitivity case.
For each sensitivity case it solves, HOMER simulates every system in the Size your own and ranks all the feasible systems according to increasing Net Present Cost in the Sensitivity Cases table. The Optimization Results table lists all the feasible simulations for a selected sensitivity case. (Non-feasible systems are not shown.)
You can also view Simulation Results in a wide variety of tables and graphs that help you compare configurations and evaluate them on their economic and technical merits. You can export the tables and graphs for use in reports and presentations. Double-click a system in the Optimization Results table (the lower table) to see its details in a Simulation Results window.
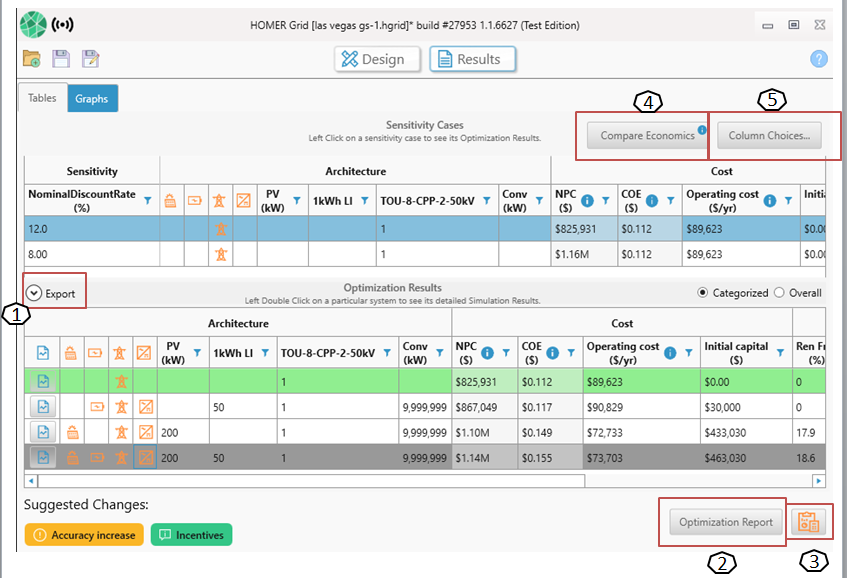
Below is a screenshot of the Tables Mode of the results in HOMER Grid:
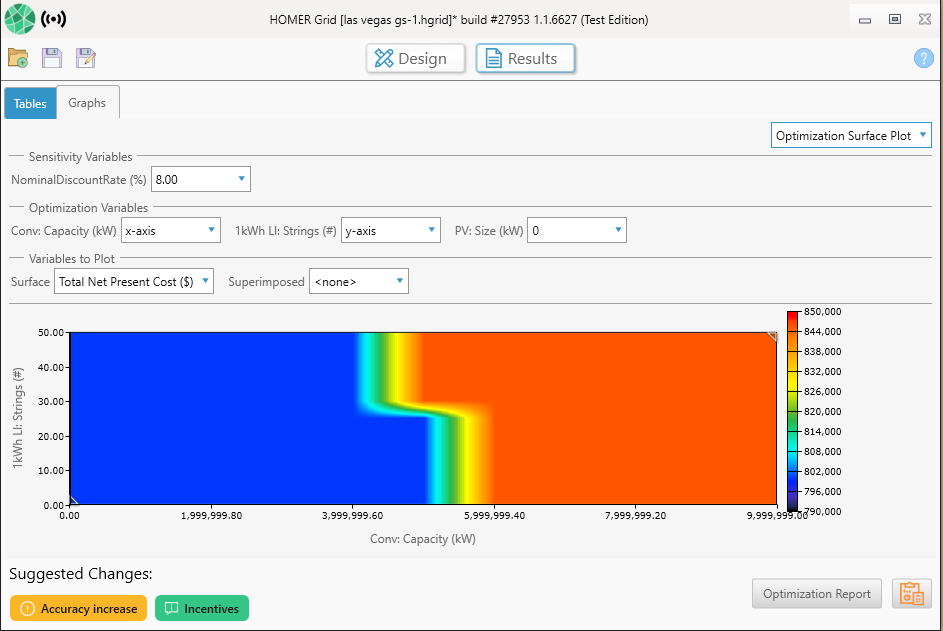
Graphs Mode
If you choose the Graphs Mode, you can view several types of plots to better visualize the sensitivity plots and the optimization plots.
Other Options
Several buttons on the Results page provide additional options:
1.Export
2.Optimization Report
3.Calculation Report
4.Column Choices
5.Compare Economics
The above options are labeled in the same order in the screenshot below:
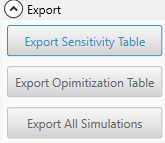
Export Button
Click the export button located above the optimization results. You can then choose to export the results of sensitivity, optimization or all simulations into a csv file.
Optimization Report Button
Click the Optimization Report button on the bottom right corner of the results page to get a summary report of all the optimizations for a given sensitivity.

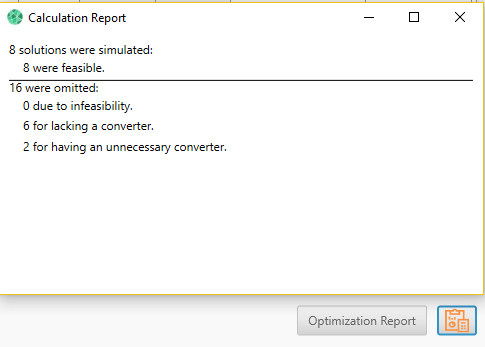
Calculation Report Button
Click the calculation report button on the bottom right corner of the results page to get a summary of the simulations. 
Below is a sample calculation report:
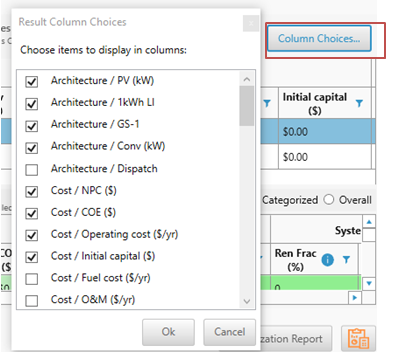
Column Choices Button
Click the column choices button on the top right of the tables view, to add or remove columns to the results table.
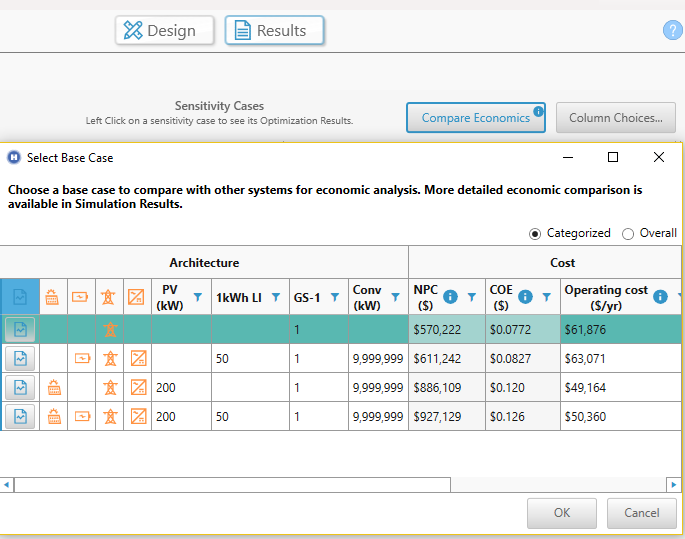
Compare economics button
Click the Compare Economics button to select a base case system and compare a system to it. See the Compare Economics section of the help for a description of this process
See also
