
HOMER Grid 1.10

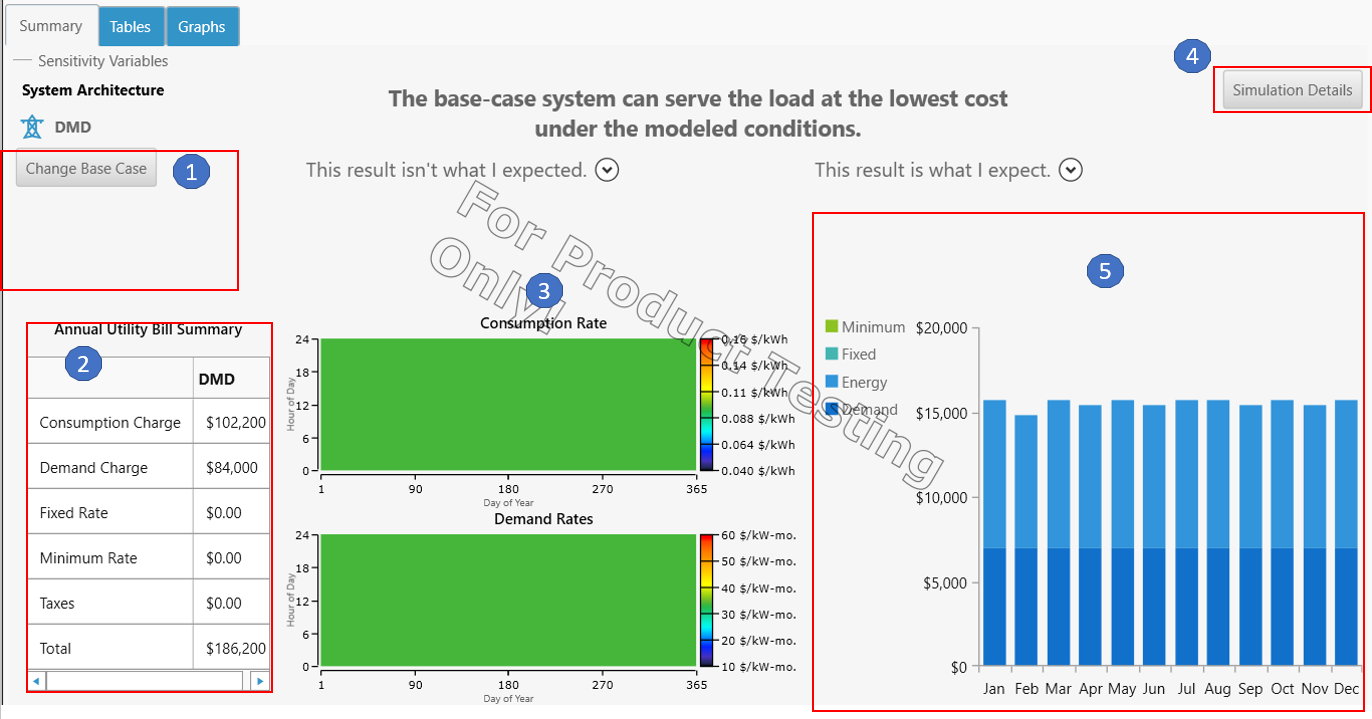
The screenshot below is an example of how the summary tab looks when the utility only system wins (also when base case wins). The sections numbered in the image are described below
Section 1: the architecture of the base case. Since this is the summary for utility only system, it displays the tariff name. You may change the base case by clicking on the “Change Base Case” button.
Section 2:
Section 3: the DMAPs of the consumption and demand rates
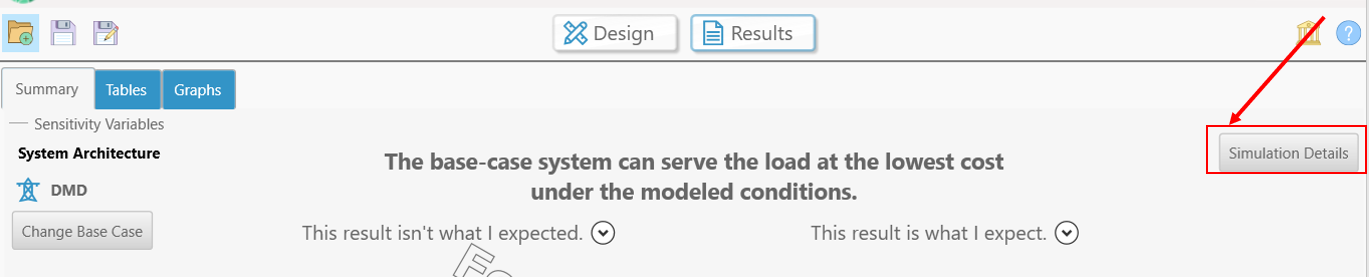
Section 4: access to the simulation details of the winning system (which is the base case system in this case)
Section 5:
Section |
Variable |
Description |
1 |
System Architecture |
This section shows the architecture of the base case (and in this case the winning system). Since this is the summary for utility only system, it displays the tariff name. You may change the base case by clicking on the “Change Base Case” button. |
2 |
Annual Utility Bill Summary |
This section shows a breakdown of the utility bill by consumption, demand, fixed, minimum and taxes. |
3 |
Consumption and Demand Rate DMAPs |
This section is a DMAP of both Cons |
4 |
Simulation Details |
This button gives you access to the simulation details of the winning system – cash-flow, Time Series, etc. This is a short-cut to the simulation results for the lowest NPC system, which you can also access from the ‘Tables’ tab. |
5 |
Utility Bill Summary Graph |
This graph shows the utility bill by month and category of charges (consumption, demand, fixed, minimum) |
This result isn’t what I expected
If you did not expect the utility only system to be the winning system with the lowest NPC, then here are a few things you could do.
1.Check your inputs. If the utility-only system is the lowest NPC system, it could mean that the electricity available from the grid is too cheap. Check that the utility costs are accurately captured by the tariff rate structure. Check the costs of the distributed generation sources. If the prices are accurate, consider running a sensitivity on component prices to understand at what price the hybrid system is economically viable.
2.Get details from Calculation report. You may access this by clicking on the icon on the bottom right highlighted in the image below. The calculation report will give you insight into what simulations were tested but found infeasible, if any. Based on information from the calculation report, you may want to adjust the inputs to your model.
3.If you are comparing two tariffs, then make sure to select the right tariff as the base case. You may do so by clicking on the “Change Base Case” button in the system architecture shown in the image below.
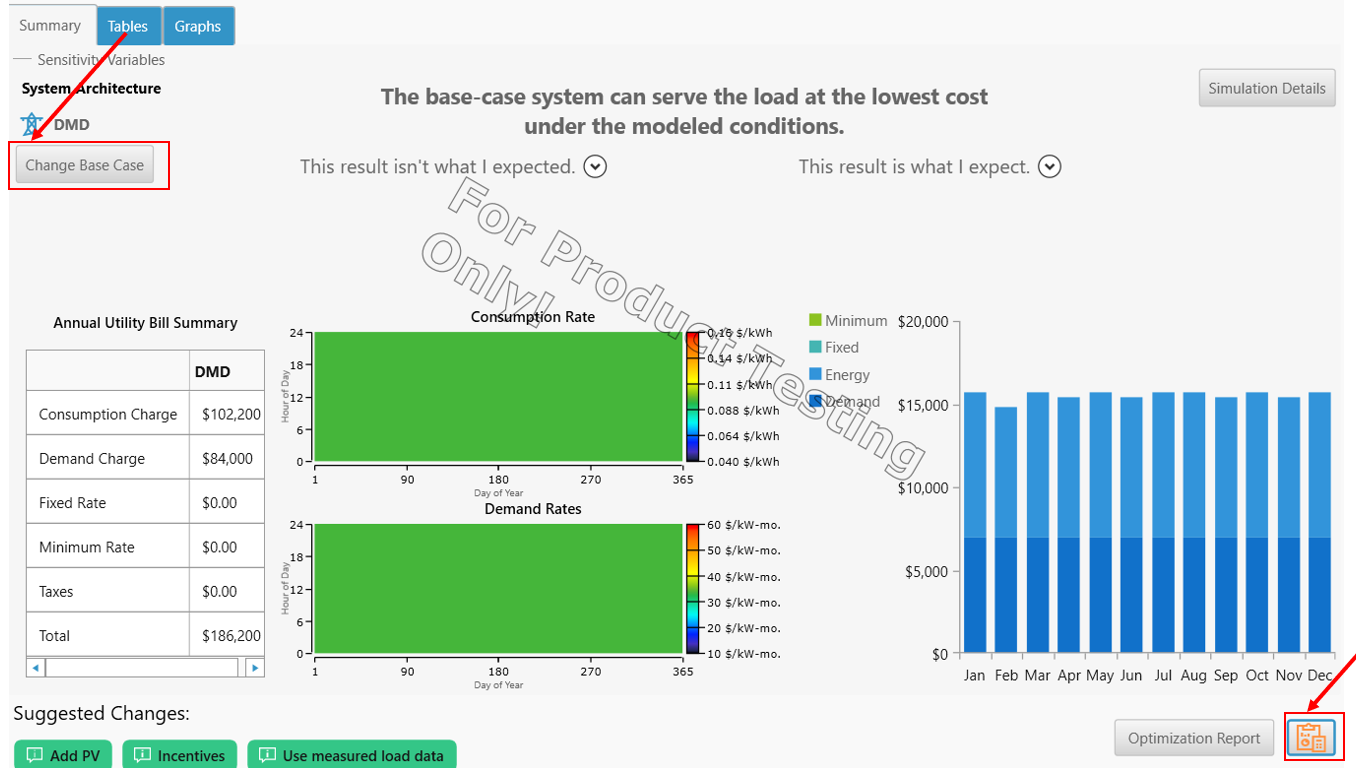
4.If NPC isn’t the metric that you are interested in, you may access other system configurations in the Tables tab as shown below. In the Tables tab, you may see the whole range of simulations which were calculated by clicking the Overall view instead of the Categorized view. You may choose, for example, which simulation has the lowest annual utility bill or which system has the highest renewable fraction. These other metrics may be more important than the lowest NPC system.
This result is what I expect
If you expected the utility only system to win or the base case to win, you may then
1.Access the simulation results to get the cashflow, Time Series, etc.
2.Access other system configurations in the Tables tab.
