
HOMER Grid 1.10

There are three ways to Compare Economics within HOMER Grid. Select a link below for more detailed information.
•Compare Economics in Summary Mode
•Compare Economics in Tables Mode
•Compare Economics in Simulation Results
Compare Economics in Summary Mode
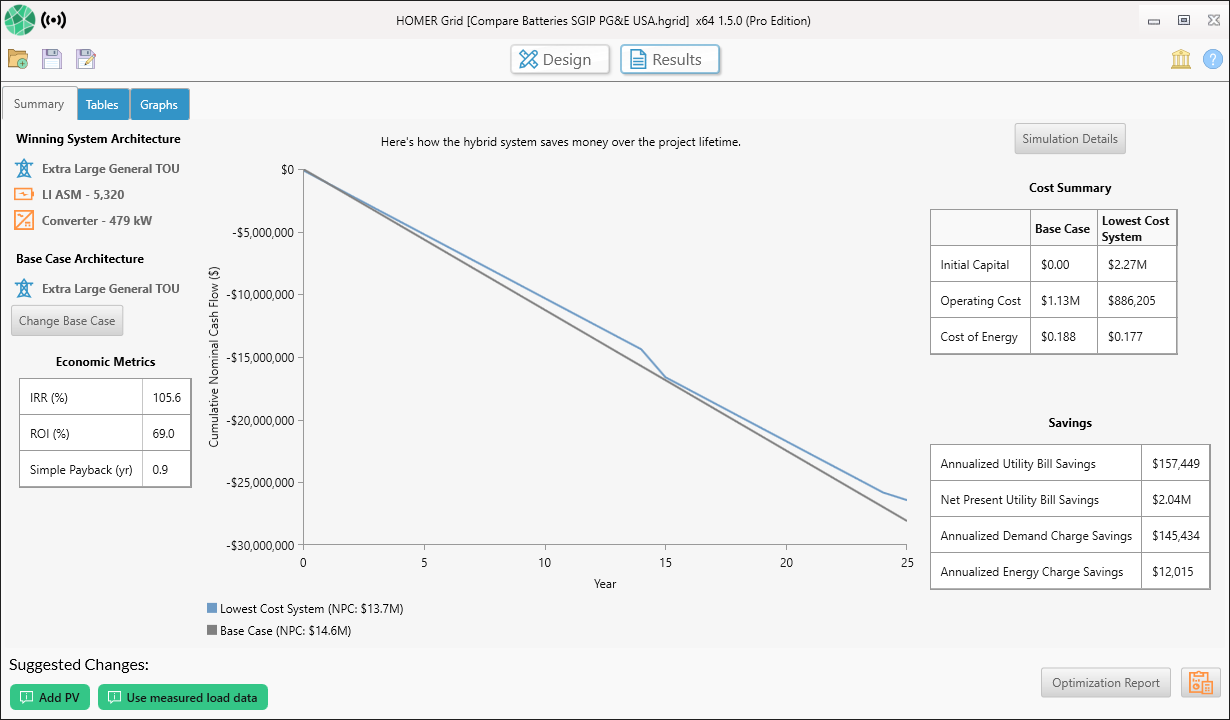
After the results have been calculated, the first view you will see is the Summary Tab. The Summary Tab includes an economic comparison between the winning system/lowest net present cost and the selected base case. Please note, the Summary Tab will appear different if the base case is the winning system or if there are no feasible solutions.
For more specific information about your Summary Types results, visit one of the links provided below.
•Summary with a base case and a winning case
•Summary when a utility only system wins or if the base case is the winning system
•Summary when there are no feasible solutions
Summary Data
Winning System Architecture
The winning system is the system with lowest Net Present Cost. You may select a different winning system on the summary tab by changing the sensitivity variables from the drop-down menu. If there are no sensitivity variables, this section will appear blank. To view details for other system configurations, select the Tables tab.
Base Case Architecture
The base case system is the system with the lowest initial capital cost. There could be scenarios where the base case system is also the winning system. You may change the base case system in the summary tab if you select the Change Base Case button.
Economic Metrics
The Economic Metrics table shows economic measures representing the value of the difference between the two systems.
•Internal rate of return (IRR) is the discount rate at which the base case and current system have the same net present cost. HOMER calculates the IRR by determining the discount rate that makes the present value of the difference of the two cash flow sequences equal to zero.
•The Return on Investment (ROI) is the yearly cost savings relative to the initial investment. The ROI is the average yearly difference in nominal cash flows over the project lifetime divided by the difference in capital cost.
•Simple payback is the number of years at which the cumulative cash flow of the difference between the current system and base case system switches from negative to positive. The payback is an indication of how long it would take to recover the difference in investment costs between the current system and the base case system.
Plot of Cash flow over Project Lifetime
The plot in the center of the Summary Tab displays how the hybrid system saves money over the project lifetime- the cumulative nominal cash-flow over the project lifetime. The blue line represents the winning system and the gray line represents the base case system. The simple payback in years occurs when the two lines cross each other and is highlighted by the black line in the plot.
Cost Summary
The cost summary shows a cost comparison between the Base Case and the lowest cost system/winning system.
•The Initial Capital is the total installed cost of the system at the beginning of the project.
•The Operating Cost is the annualized value of all costs and revenues other than initial capital costs.
•The Cost of Energy (COE) is defined in HOMER as the average cost per kWh of useful electrical energy produced by the system.
Compare Economics from Tables Mode
Base Case System
The Compare Economics feature allows you to compare two systems and calculate payback or internal rate of return. To change the base case system used for comparison, click the Compare Economics button on the top right part of the Results page (highlighted in yellow below). A pop-up window appears showing a list of categorized and overall simulations. Choose a base case to compare with all other simulations. Click OK.
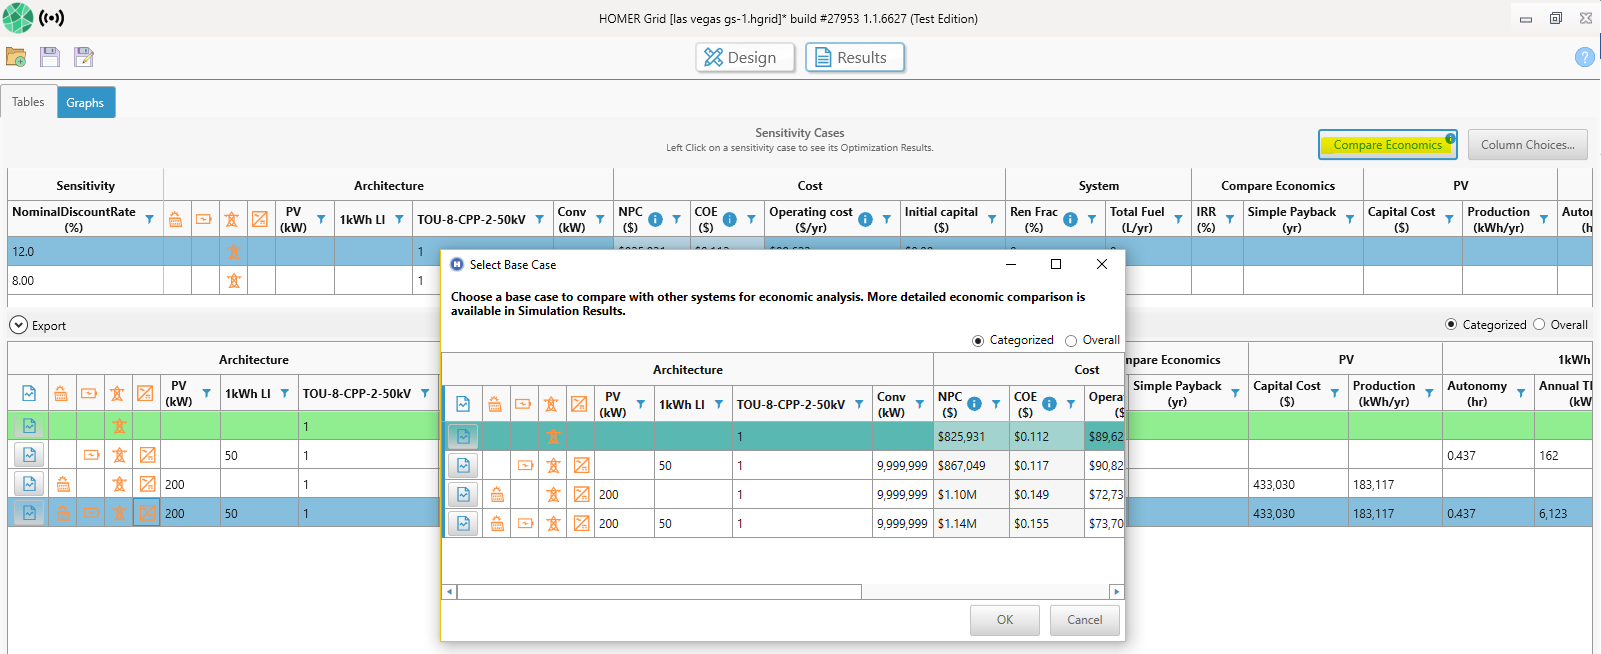
In the pop-up you can observe that a simulation is already highlighted in green. HOMER Grid has already choose a base case for you. You could also choose a base case system to compare with the current system to make the economic metrics meaningful. The metrics show you the value of the difference between two options, taking into account the life-cycle costs of both systems. You can compare the current system to any other system in the optimization results.
The table at the top of the Select Base Case pop-up window displays a list of systems from the Optimization Results from which you can choose a base case. You can display the list as a categorized list to display only the top-ranked system in each category, or as an overall list to display all systems.
The system summary table shows the component sizes, capital cost, and net present cost of the base case system and current system.
The display options control what appears in the cash flow graph.
Tip: Click and drag or click and press Ctrl+A to select the table. Then press Ctrl+C to copy the data to your clipboard. You can then paste the data into another program like Microsoft Excel or MATLAB.
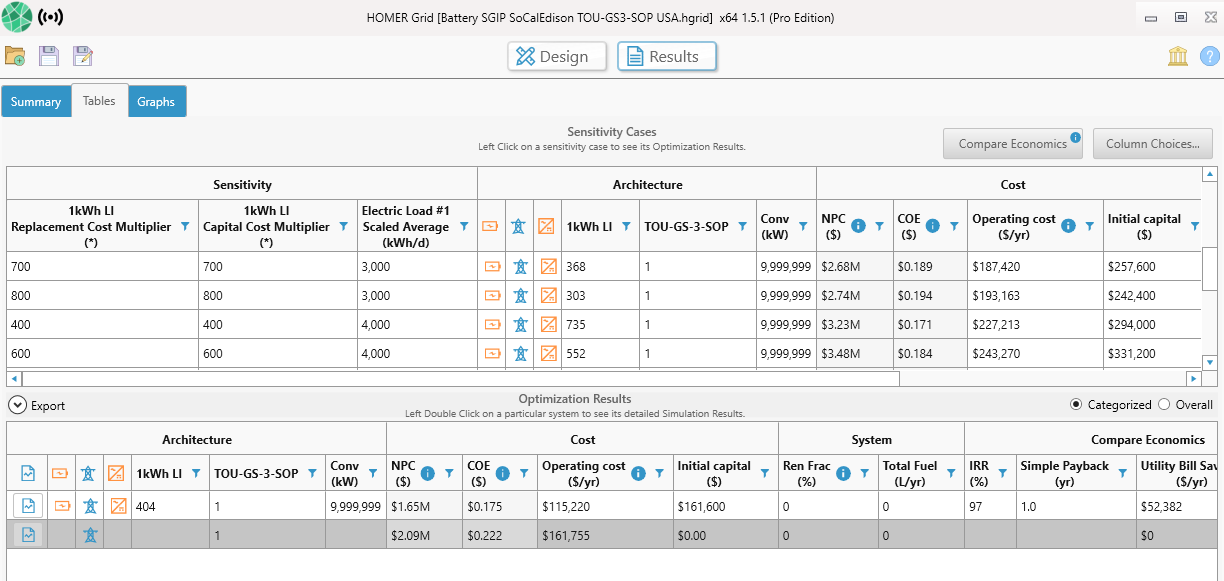
The base is highlighted in gray. The other cases have a IRR and Simple Payback (yr) to show how they fare against the base case selected.
Compare Economics Tab in Simulation Results
To open the Compare Economics tab, double-click a system in the Optimization Results table on the Results page. Click the Compare Economics tab in the Simulation Results pop-up window. This tab allows you to compare the economic merits of the current system and a base case system. The window displays cash flow graphs and a table of economic metrics.
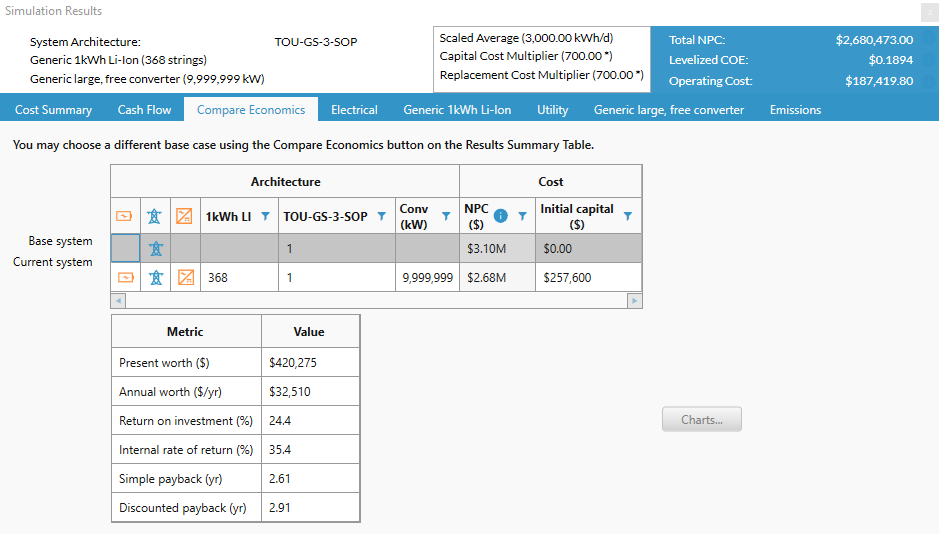
When you choose a base case system, the metric table shows economic measures representing the value of the difference between the two systems:
•The Present worth is the difference between the net present costs of the base case system and the current system. The sign of the present worth indicates whether the current system compares favorably as an investment option with the base case system: A positive value indicates that the current system saves money over the project lifetime compared to the base case system.
•The Annual worth is the present worth multiplied by the capital recovery factor.
•To see how HOMER calculates Return on investment (ROI), choose the following display options: Graph, Difference, Cumulative. Subtract the cumulative nominal cash flow in year zero from the cumulative nominal cash flow in the final year. Divide that number by the lifetime and then again by the cumulative nominal cash flow in year zero. The cumulative nominal cash flow in year zero is equivalent to the base case capital cost minus the current system capital cost.
•Internal rate of return (IRR) is the discount rate at which the base case and current system have the same net present cost. HOMER calculates the IRR by determining the discount rate that makes the present value of the difference of the two cash flow sequences equal to zero.
•Payback is the number of years at which the cumulative cash flow of the difference between the current system and base case system switches from negative to positive. The payback is an indication of how long it would take to recover the difference in investment costs between the current system and the base case system. You can see a visual representation of the payback by choosing the following display options: Graph, Difference, and Cumulative. The Simple payback is where the nominal cash flow difference line crosses zero. The Discounted payback is where the discounted cash flow difference line crosses zero.
Calculating Payback, IRR, and Other Economic Metrics
HOMER calculates payback by comparing one system with another. In general, payback tells you how many years it takes to recover an investment. You invest a certain amount of money initially, then earn income from that investment. The payback is the number of years it takes for the cumulative income to equal the value of the initial investment. HOMER can also calculate other economic metrics such as Internal Rate of Return (IRR), present worth, and return on investment.
Sometimes, the "income" of a power system can be defined intrinsically, without a reference for comparison. If, for example, a grid-sales system does not need to serve any load, but simply sells power to the grid, you can define the income of the system as the money it makes by selling power to the grid minus the expense of operating the system. In that case, you can compare the initial cost of the system with its income to calculate the payback.
Distributed power systems are typically not as simple, and the income must be defined relative to some alternative. Say you are designing a system to provide electricity to an off-grid house. A pure diesel system might have low capital cost and high operating cost, whereas a PV-diesel-storage system might have high capital cost and low operating cost. Neither system produces any income. In both cases you spend money initially to build the system, then you keep spending money each year to operate the system. The concept of payback has meaning only if you compare one system to the other. You can define the payback of the additional investment required for the PV-diesel-storage system by comparing the difference in capital cost with the difference in operating cost. HOMER does exactly that under the Compare Economics tab.
To calculate the payback of one alternative, we must compare it to another alternative. Even to calculate the payback of the simple grid-sales system mentioned above involves an implicit comparison with the base case, which is to do nothing. The do-nothing alternative is easy to compare because all its costs are zero. However, if an electric load must be served, the do-nothing alternative is not acceptable.
A renewable power system designer often uses a non-renewable power system as the base case, but HOMER lets you choose any base case you want. You can compare a system with two wind turbines to a system that has one wind turbine to calculate the payback of the second wind turbine. Or you can compare a PV-diesel-storage system with a PV-diesel system to calculate the payback of the storage.
