
| Forecast Error Window | |
This feature is coming soon to Windographer 5.
The Forecast Error window allows you to compare the difference between two columns. If you have a column of forecast wind speed (or turbine output power, temperature or some other data type) and also a corresponding measured column, this window displays the patterns in the forecast errors. You can access this window from the bottom of the menu.
Tip: You can use the Forecast window only if you have the Professional or higher edition of Windographer. Please visit www.windographer.com for information on the pricing and capability of each edition.
Using the drop-down boxes in the top left corner of the window, select the data columns that contain the true measured values and the forecasted values. You can now view the calculated error between the two columns in a variety of graphs and tables. The window below shows the summary.

The filter settings allow you to filter data according to flag status, date, or the value of a particular data column. In the example above, the user has excluded data flagged as 'Low Quality', and also fitered based on the value of the data column named 'Wind Capacity'. More details appear in the article on filtering data.
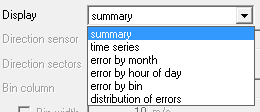
You can view the original and error data in the various graphs and tables using the Display drop-down box and the Format buttons.
Right-click any graph to change its properties, copy the image to the clipboard, or export it to a file. Right-click on any table to export it to a file, or copy it. The articles on exporting graphs and exporting tables give further details.
Windographer calculates the error using three different metrics:
Choose to display the time series graph to see the error in each time step. The window displays the time series of bias errors (forecast minus true), absolute errors (absolute value of bias error) and squared error (square of bias error). From these three time series Windographer calculates MBE, MAE, and RMSE respectively. To see the frequency distribution of bias error, choose to display the distribution of errors.
To calculate the forecast errors, Windographer performs the following steps:
See also
Mean Absolute Error definition
Root Mean Squared Error definition