
| Gauss-Weibull Equation | |
The Gauss-Weibull equation gives the gust factor as a function of turbulence intensity, length of time step, and gust averaging time:
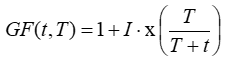
where: | ||
| GF(t,T) | is the gust factor for averaging time t in time step T [unitless] | |
| t | is the gust averaging time [s] | |
| T | is the length of time step [s] | |
| I | is the turbulence intensity [unitless] | |
| x() | is the quantile function of the standard normal distribution |
The Gauss-Weibull equation uses the assumption that the wind speed measurements made over multiple short time intervals within a time step conform to the normal (Gaussian) distribution. It also uses the Weibull plotting position estimators to represent the cumulative probability corresponding to the peak gust within the time step.
Plotting position estimators (see section 3.3.7 of Wilks, 2011) are equations for the cumulative probability of the rank of each value in a ranked set of N values. Imagine we have a set of N values of a variable z that we have sorted in ascending order, so that z1 is the smallest of the values, z2 is the second smallest, z3 is the third smallest, and so on until the largest value zN. The Weibull plotting position estimator gives the following equation for the cumulative probability of value zi:
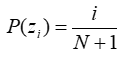
where: | ||
| P(zi) | is the cumulative probability of the i-th ranked value [unitless] | |
| i | is the rank, ranging from 1 for the smallest value in the set to N for the largest | |
| N | is the number of values in the set |
If a time step of length T comprises N individual wind speed measurements, each averaged over a smaller interval t, so that N = T / t, then the Weibull plotting position estimator gives the cumulative probability of the peak gust as:
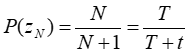
If those individual speed measurements are normally distributed within the time step, then from this cumulative probability of the peak gust we can calculate the gust factor with the following equation:
where: | ||
| GF(t,T) | is the gust factor for averaging time t in time step T [unitless] | |
| t | is the gust averaging time [s] | |
| T | is the length of time step [s] | |
| I | is the turbulence intensity [unitless] | |
| x() | is the quantile function of the standard normal distribution |
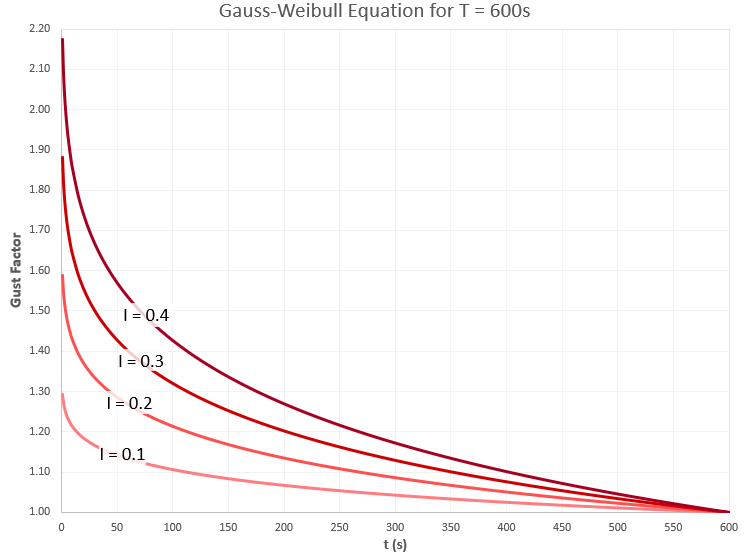
The graph below shows the output of the Gauss-Weibull equation for the case of ten-minute time steps and various values of turbulence intensity:
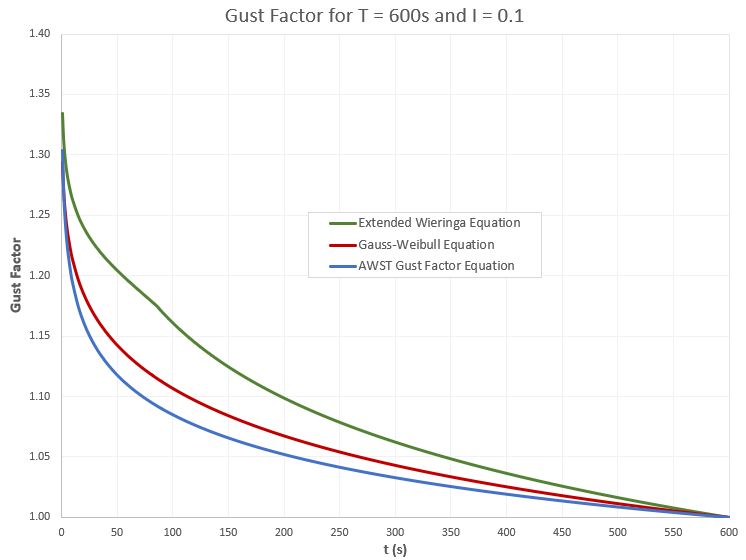
The graph below compares the Gauss-Weibull equation to the other two gust factor equations Windographer implements, namely the extended Wieringa equation and the AWST gust factor equation, for the case of ten-minute time steps and 10% turbulence intensity:
See also