
| Exporting to WindFarmer | |
The WTI file format is a text format containing turbulence data can be read by the wind farm design software WindFarmer. You can export WTI files from the WindFarmer tab of the Export Data window.
Tip: This tab will appear in the Export Data window only if your dataset contains speed, direction, and turbulence data.
In order to calculate turbulence intensity, the dataset must contain at least one wind speed data column that has a corresponding standard deviation column or an associated turbulence intensity column. The WTI file contains three tables organized by by direction sector and wind speed bin. If the dataset contains multiple wind speed and direction sensors, you can choose the speed and direction sensors upon which to base the bins. You can also choose the number of wind direction sectors, and whether to calculate from the entire data set or just a subset in the calculations.
A preview of the file appears in the window. The columns correspond to direction sectors, and the rows to 1 m/s wind speed bins centered on the integer wind speeds, so the first row corresponds to a speed range of 0.5-1.5 m/s, the second to 1.5-2.5 m/s, the third to 2.5-3.5 m/s, and so on. The first table reports mean turbulence intensity (TI) in percent, the second table shows the standard deviation of the wind speed standard deviation values in m/s, and the third table contains the number of data points in each bin. This number of data points takes into consideration your flag filter settings and date range settings, as well as the requirement for valid direction values.
Windographer applies the following logic when creating the first two tables in the WTI file: If for some speed bin and direction sector the number of occurrences is less than 5, then for that cell it reports the all-sectors mean value for that speed bin. However if that all-sectors mean value is itself based on fewer than 5 occurrences, then it instead reports the overall mean value (all sectors and all speeds).
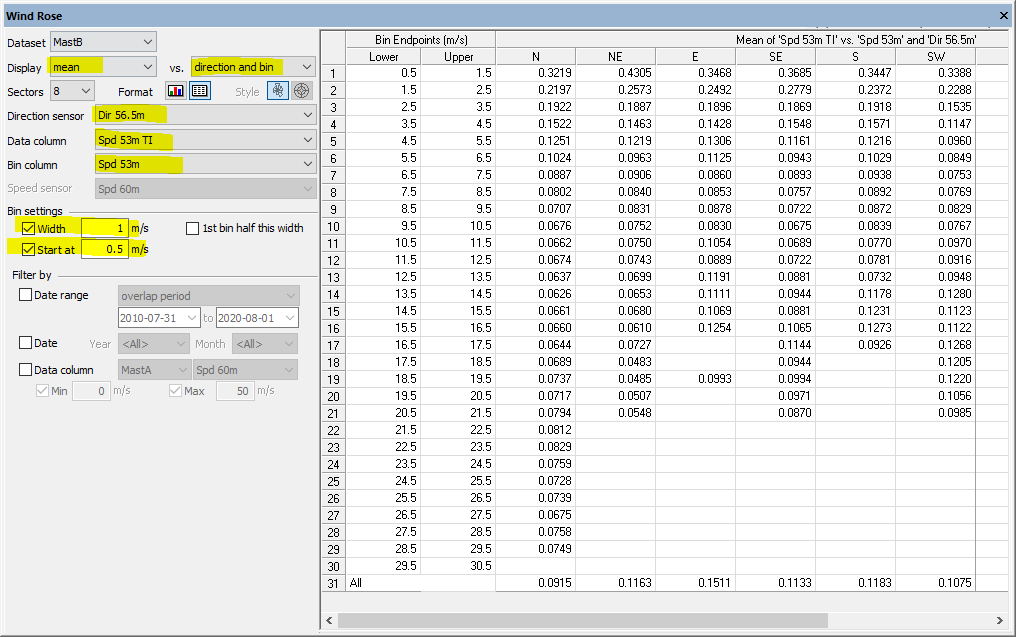
Windographer's Wind Rose window can help you check the calculations in the WTI file. For example, for a dataset containing speed column 'Spd 53m', standard deviation column 'Spd 53m SD', and direction column 'Dir 56.5m', the screenshot below shows the settings that would produce a mean TI table equivalent to the first table of the WTI file. (Note that the mean TI values will differ by a factor of 100 because Windographer normally reports TI in fractional units, whereas the WTI file reports mean TI in percent.)
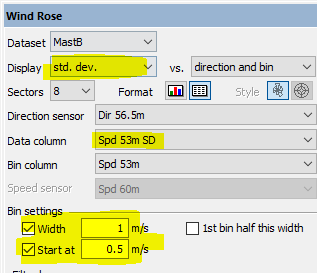
These settings will create the second table in the WTI file:
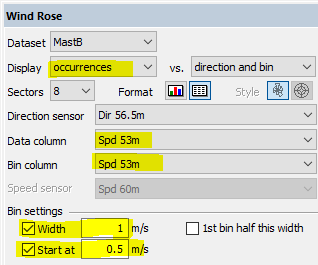
And these settings will create the third table in the WTI file:
See also
Turbulence Intensity definition