HOMER Grid 1.10

The Reliability tab is visible in the Simulation results pop-up.
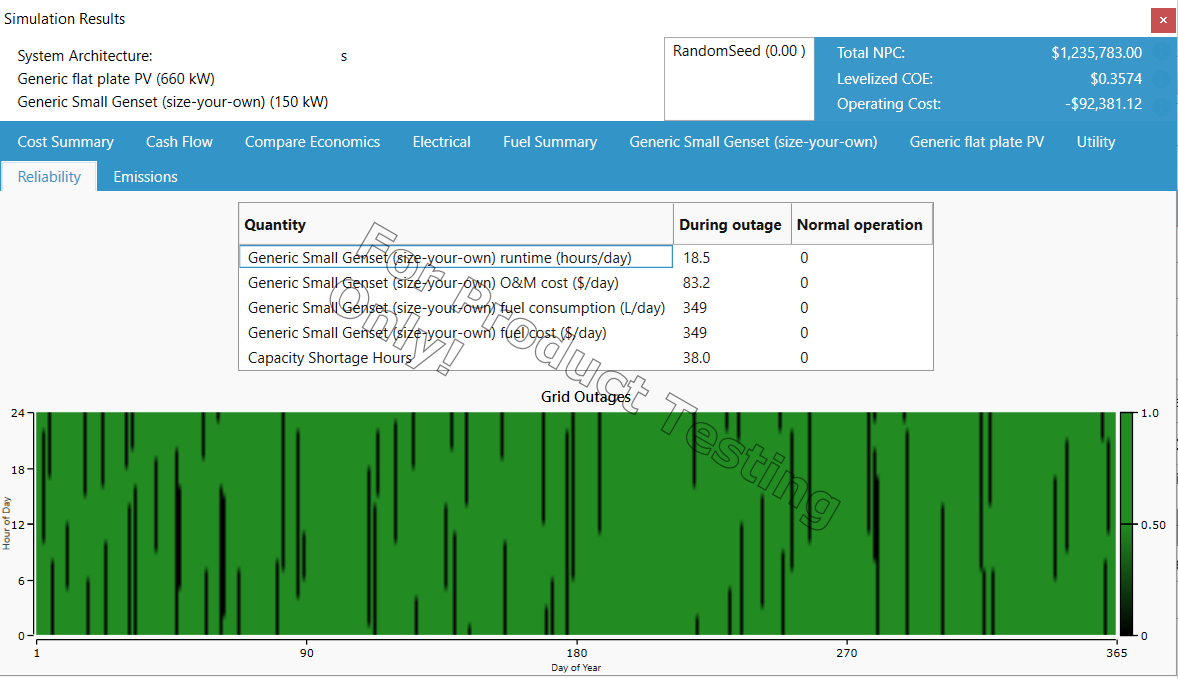
The visualizations show a time series plot of the outage occurrence. Outages appear in black; regular grid operation appears in green.
The variables referenced on the Reliability tab include:
Variable |
Description |
Generator runtime (hours/day) |
Average number of hours per day that the generator is operating |
Generator O&M ($/day) |
Average operational costs of the generator |
Generator fuel consumption (L/day) |
Average fuel consumed by the generator per day |
Generator fuel cost ($/day) |
Average cost of the fuel consumed by the generator per day |
Battery throughput (kWh/day) |
Average kWh that the battery outputs per day |
Capacity Shortage Hours (hrs) |
Number of hours when capacity reserve was not met |
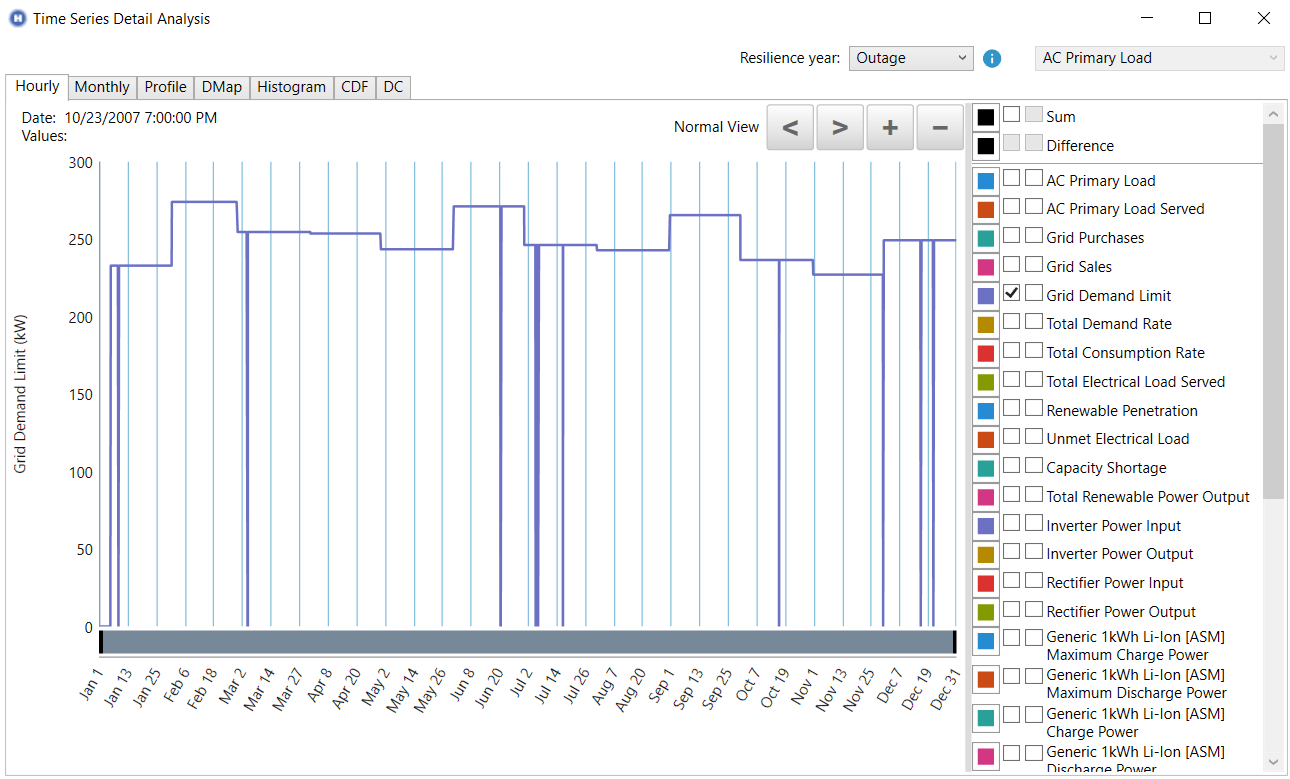
If you want to explore outages in the Time Series, then select "Grid Demand Limit". This would go to 0 whenever there is an outage.