HOMER Grid 1.10

There are a number of ways to view the results for a Multi-Year model. The summary tables displayed in the Results page for Sensitivity and Optimization are largely unchanged, although the Results reflect the effects of the Multi-Year simulation. When you run a Multi-Year calculation, the Simulation Results window includes options to allow you to view year-by-year outputs from the Multi-Year simulation.
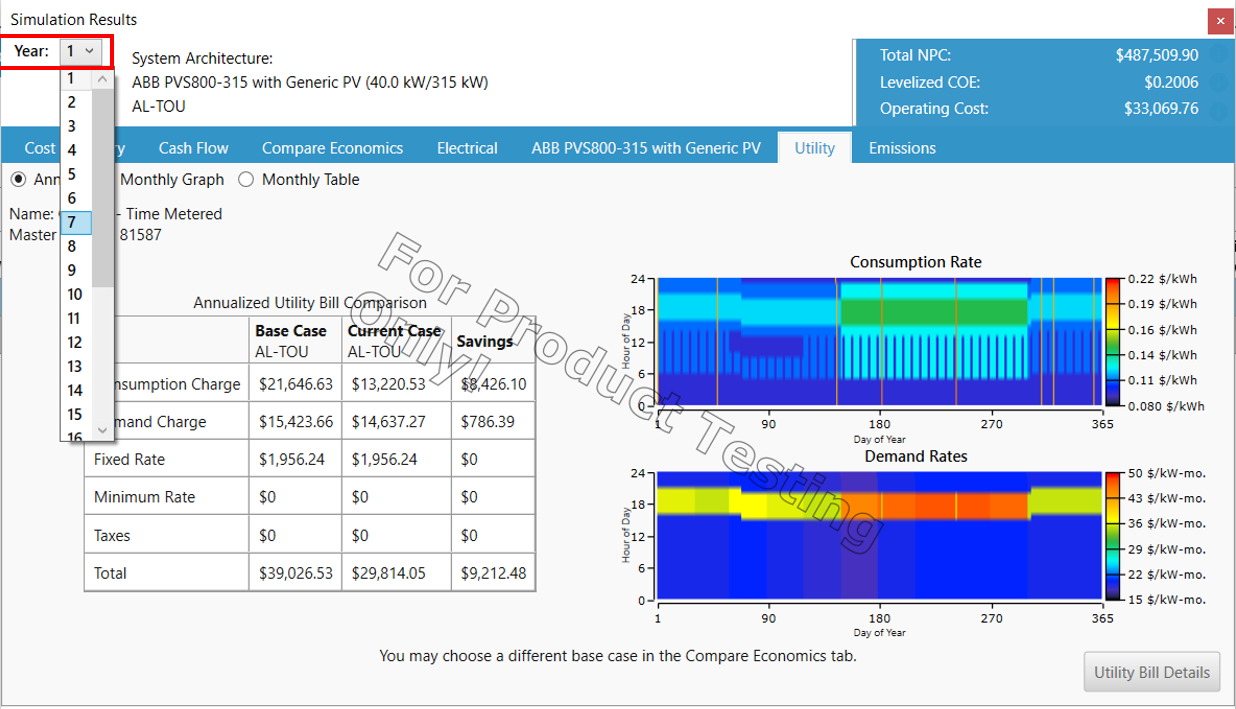
Use the drop-down menu in the upper-left of the results window to select a different year to view in the results. By switching among different years, you can see how the outputs vary over the years of the project lifetime. In the Cost Summary and Cash Flow tabs, the year selector drop-down menu is disabled because these screens show outputs that are an aggregate of all the years in the simulation.
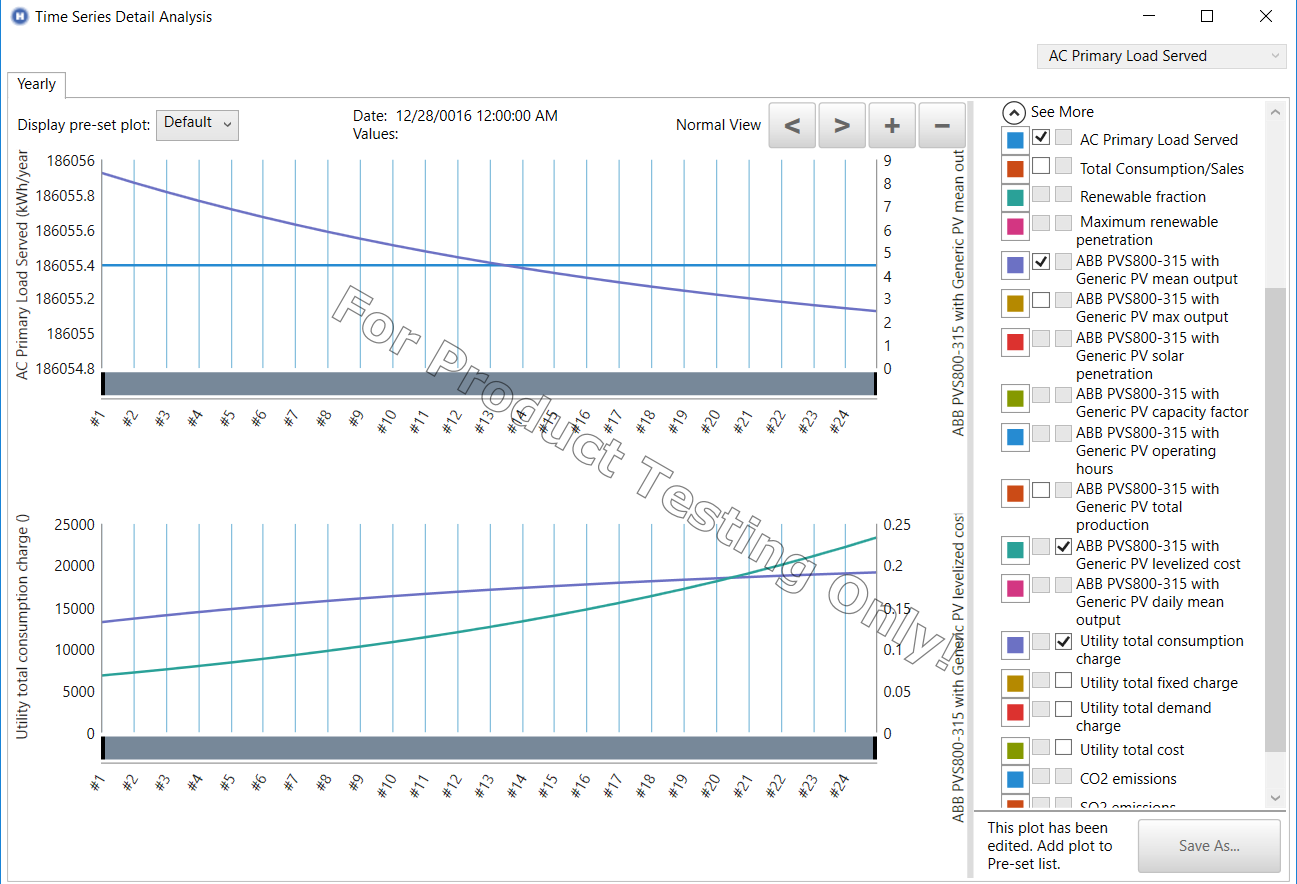
Yearly Plot
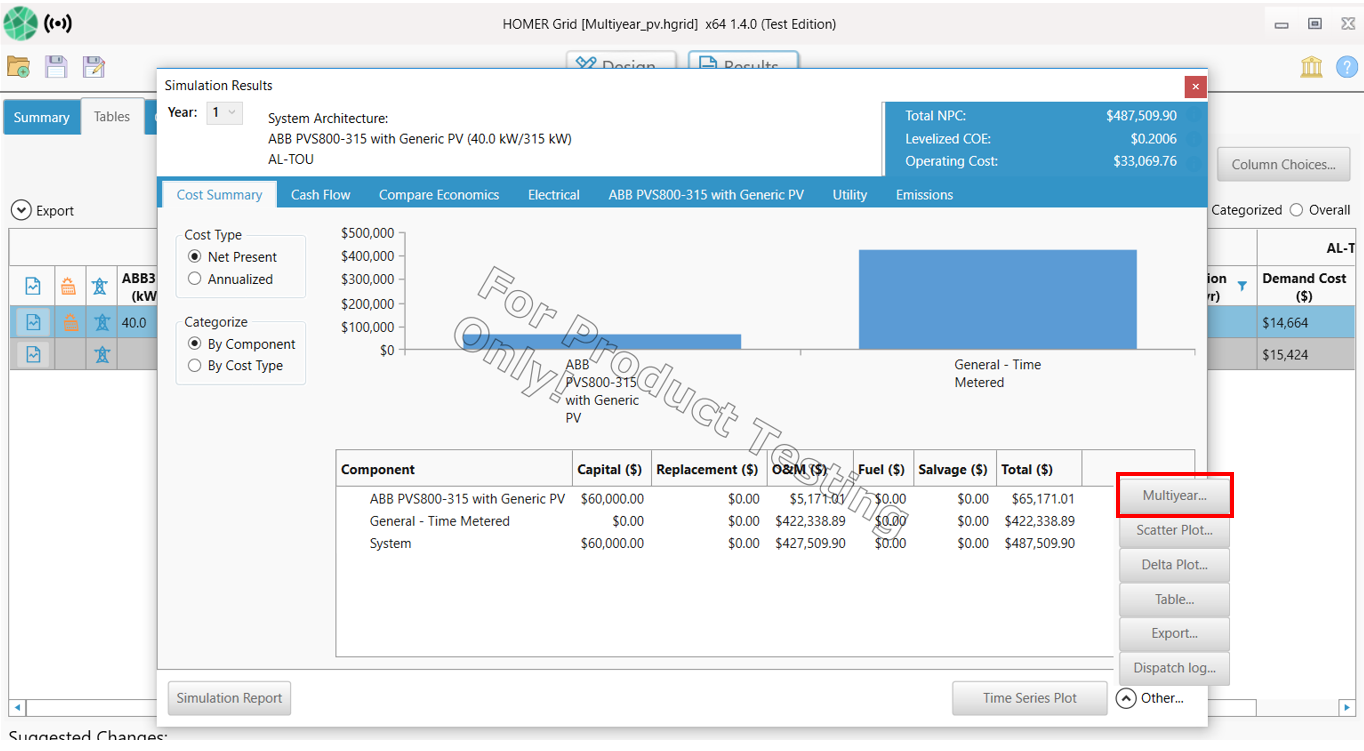
When you run a Multi-Year analysis, the Multi-Year button is at the bottom of the Simulation Results window. Click this button to show the yearly plot, which can plot many different output values over the lifetime of the simulation.