
HOMER Grid 1.10


The Electric Vehicle tab in the Simulation Results window will contain an Annual, Daily Profile, and Single Session tab.
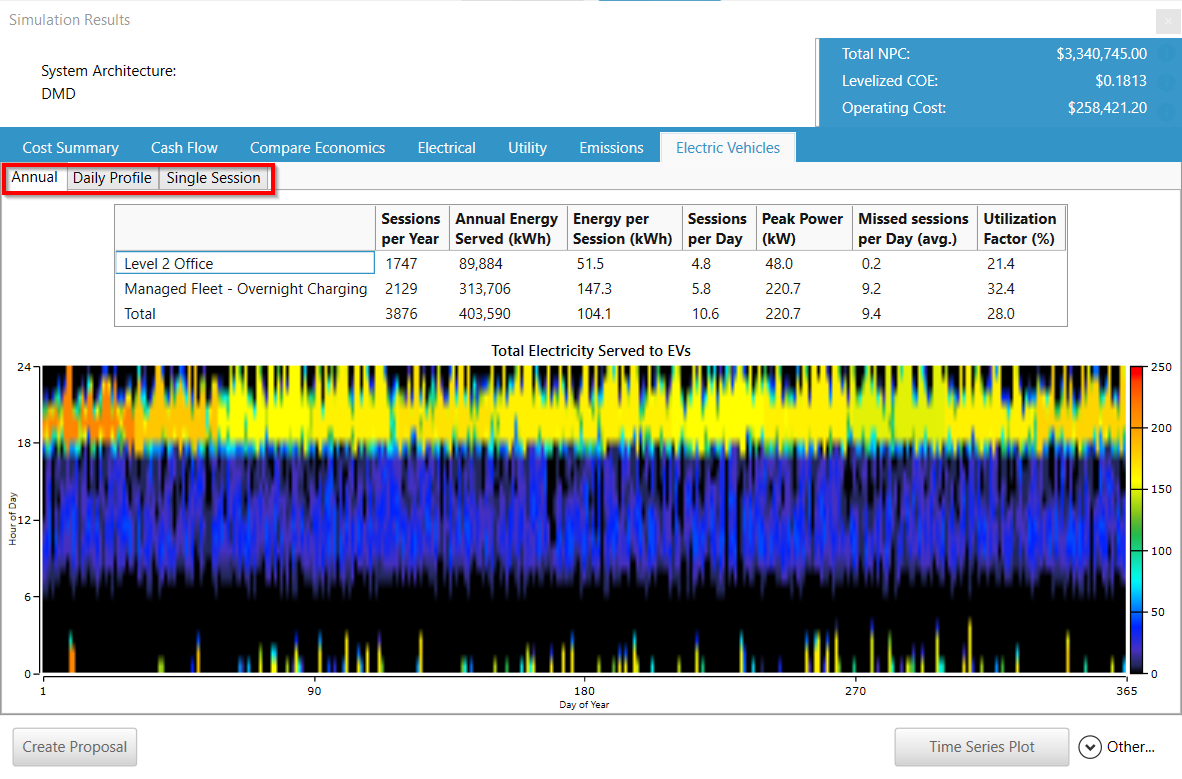
Annual
Variable |
Description |
Sessions per Year |
The total number of sessions per year for a specific charging station. |
Annual Energy Served (kWh) |
The amount of energy provided for a single year |
Energy per Session (kWh) |
The amount of energy provided per session |
Sessions per Day |
The number of sessions per day for the charging station |
Peak Power (kW) |
Peak power of the charging station |
Missed Session per Day (avg.) |
The average number of sessions missed in a day. (The number of chargers does not meet the number of vehicles that arrive if above zero.) |
Utilization Factor (%) |
The amount of time an EV is connected to a charger and charging. If two cars are charging for 1 hour each day the Utilization Factor is (2*365)/(8760) = 8.3%. This is also referred to as Utilization Rate (UR). |
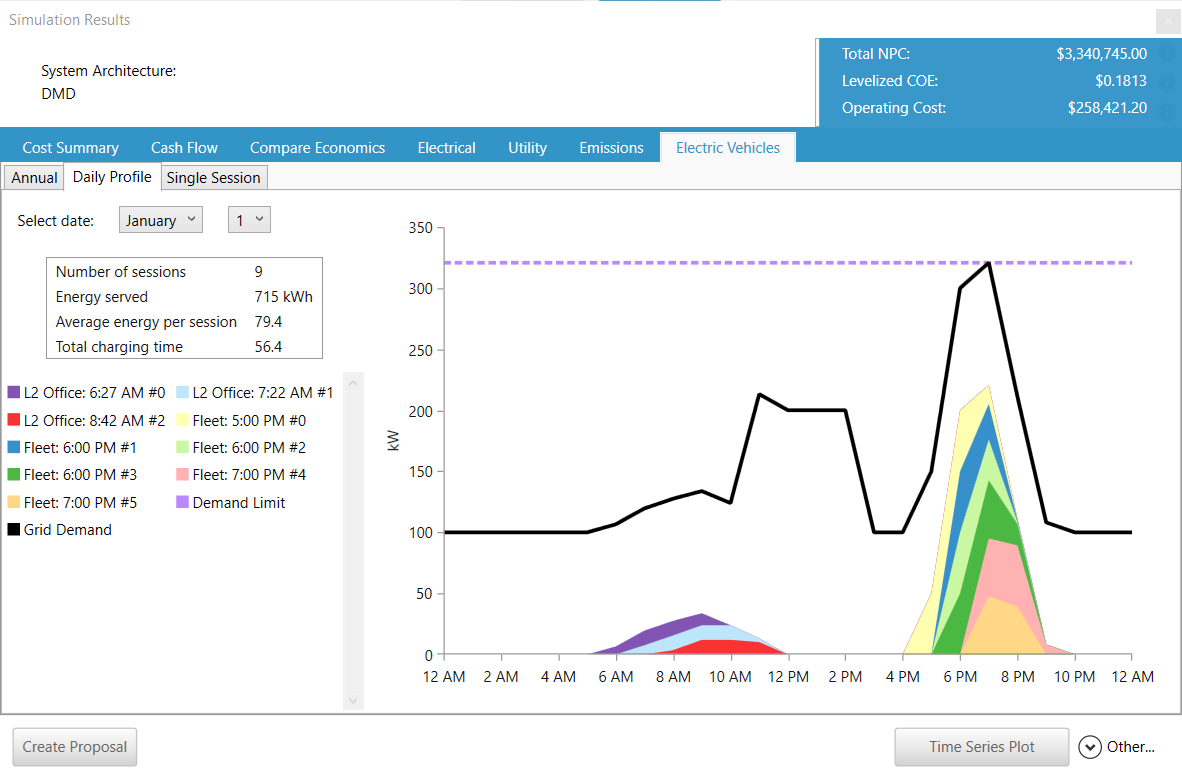
Daily Profile
Select a date from the drop-down to view a profile of the Electric Vehicle charging sessions for a specific day.
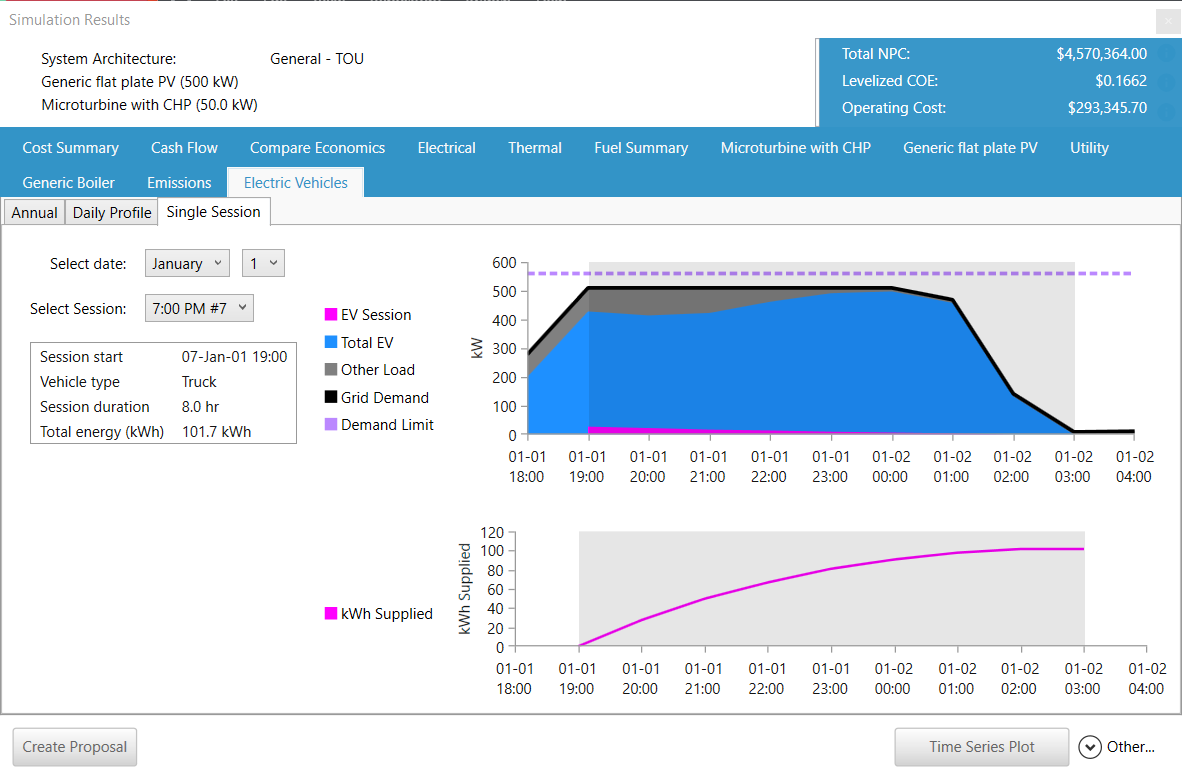
Single Session
Select the Single Session tab to further view how the load is being served for one EV session.
See also
