HOMER Grid 1.10

![]()
The Deferrable EV Charger allows users to optimize their charging stations and have some flexibility for when the Electric Vehicles are charged throughout the day. You can select one of the templates from the drop-down or create your own in the EV Charger Library. Click Copy to Library to save your design.
Click on a link for more information about each section on the Deferrable EV Charging page.
Charging Station
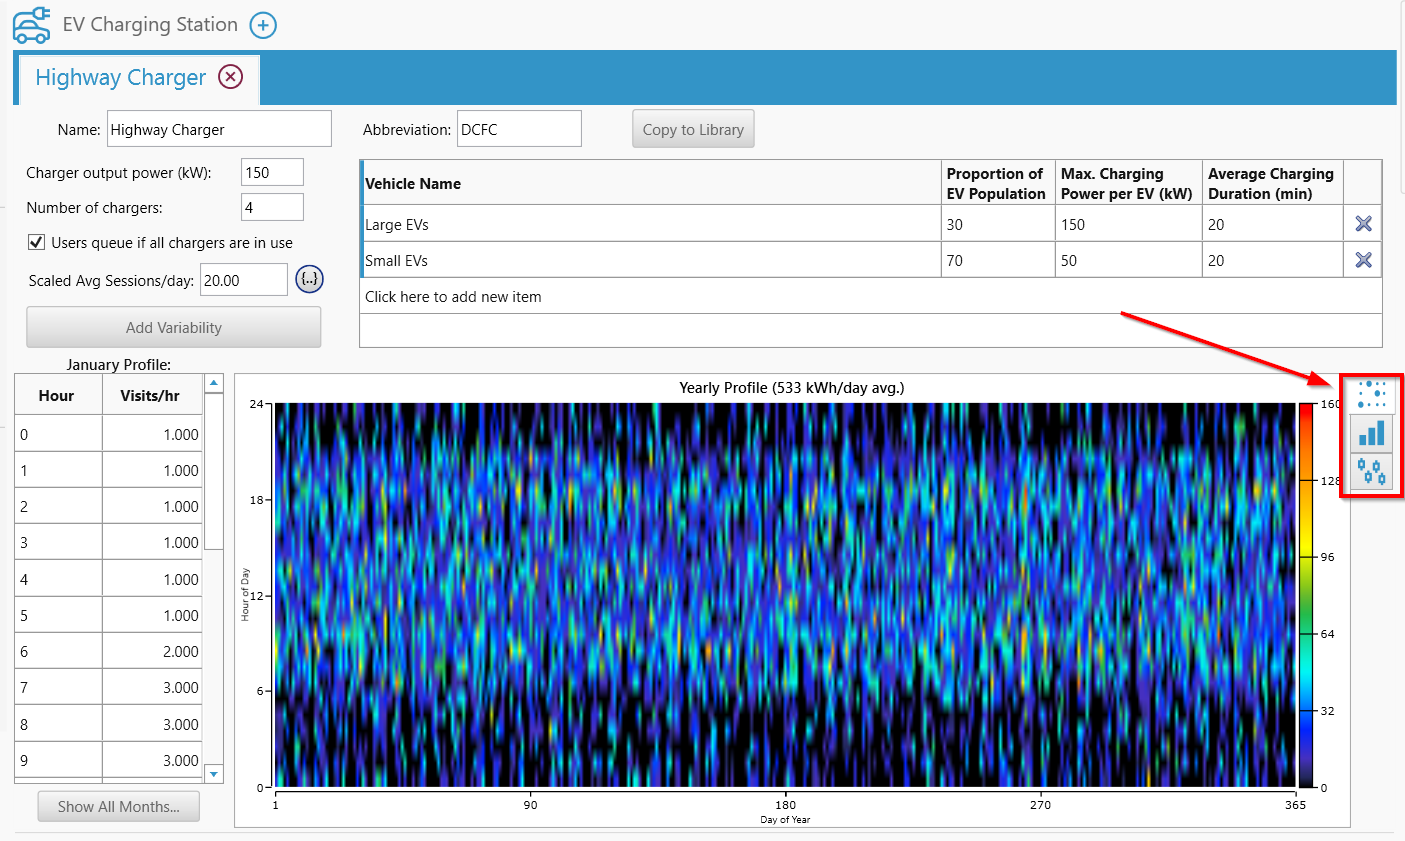
Edit the inputs in the charging station section to customize the charger(s) to your specifications. The table provides a brief description of each variable in the section.

Variable |
Description |
Charger output power (kW) |
The output of kW per charger |
Mean time connected (hr) |
The mean amount of time in hours the vehicle is connected to the charging station |
Number of chargers |
The number of chargers at the charging station |
Scaled avg sessions/day |
The average number of vehicle charging sessions per day |
Charging price |
Used to calculate revenue from vehicles using the charging station |
Note: For every specified session, a random electric vehicle will be drawn from the Electric Vehicle population inputs.The exact minute the car arrives will be assigned randomly within the specified hour.
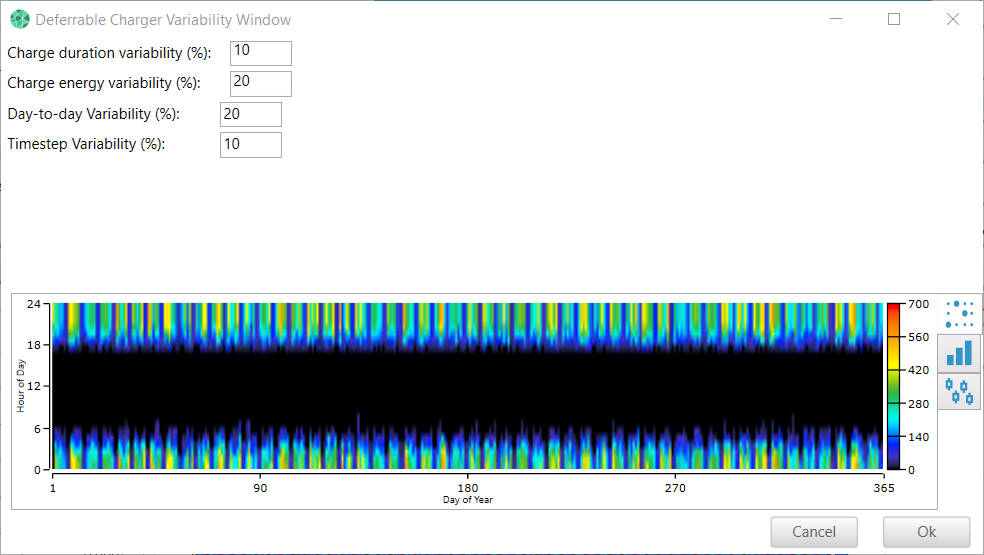
Select Add Variability to edit the percentage of variability you would like HOMER to consider when running a simulation.

Electric Vehicles
Edit the vehicle properties to customize the Electric Vehicles you want to include in your model. Click here to add new item to expand your list of EVs. The table provides a brief description of each variable in the section.

Variable |
Description |
Name |
The name or description of the vehicle |
Proportion of EV Population |
The proportion of the vehicle population for this vehicle type |
Max. Charging Power per EV (kW) |
The maximum amount of power that can charge the vehicle |
Average Charging Duration (min) |
The amount of energy (kWh) to fully charge the vehicle |
Load Profile
Click on the Yearly, Daily, or Seasonal Profile tabs found on the right side of the page to change your load profile view.
Hourly Data
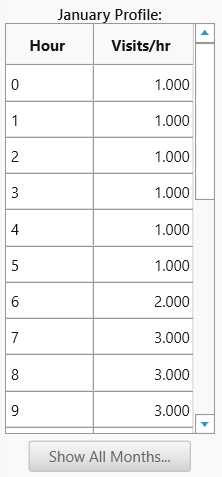
You can modify the daily number of sessions, hour-by-hour in the table on the left side of the page. The profile defines the distribution of the sessions. The number of sessions per day is defined above in Scaled avg sessions/day.

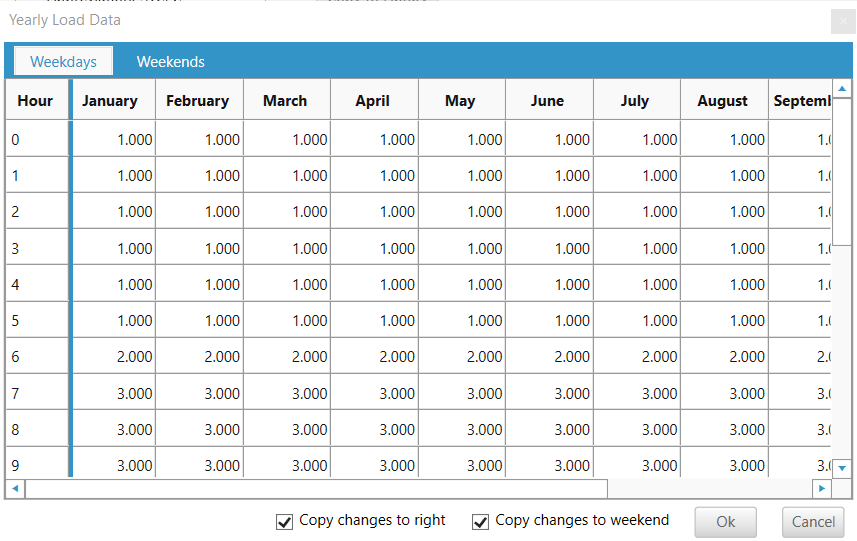
Click Show All Months... to set a different daily profile for weekends and weekdays and for each month of the year.

If you select Copy Changes to Right any value you enter is copied across all remaining months. For example, if you enter "10" for January, hour 0, all months, hour 0, are set to 10. If you then enter "9" for hour 0 in February, January stays set to 10 and February through December are set to 9. You can edit values for weekends or weekdays by selecting the respective tab at the top of the table. Changes made to the profile for weekends do not affect the profile for weekdays, and vice versa.
Scaled Average Sessions/Day
HOMER uses the scaled average sessions/day to specify how many electric vehicles could be connected to the charging station in a day. The visits per hour profile helps determine how many vehicles can connect to the charging station during the hour.

Note: The number of chargers and mean time connected can influence how the vehicles are charged throughout the day. Insufficient number of chargers or longer mean time connected could lead to missed sessions. If you want 100 sessions just on weekdays, enter (100*5/7 =) 71.42 into the average sessions per day. You can see the Sessions per Year displayed in the Results, in the Electric Vehicles tab.

