HOMER Grid 1.10

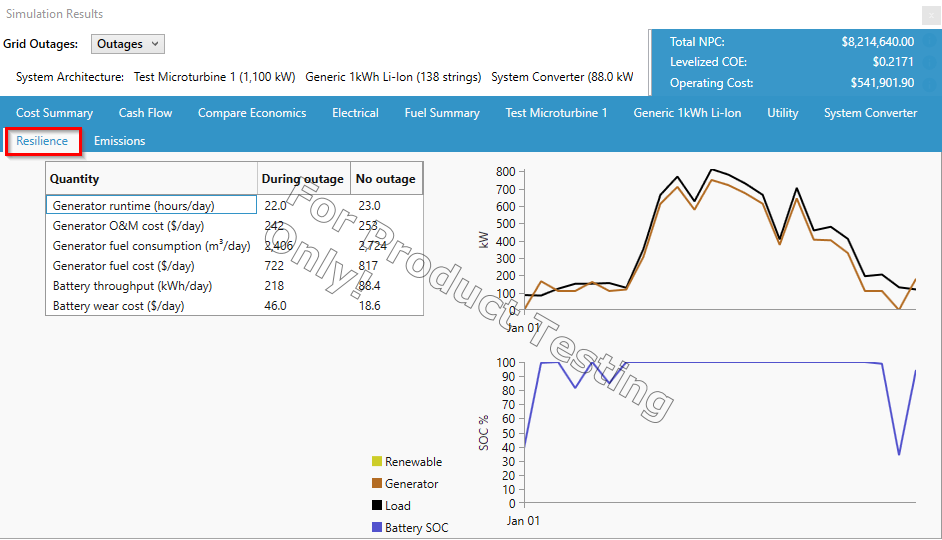
The Resilience tab can be found in the Simulation Results as shown below.

The visualizations show a time series plot during the outage. The upper graph shows how the generator plus the renewables are meeting the electric load. The lower graph shows the battery state of charge during the outage.
The variables referenced on the Resilience tab include:
Variable |
Description |
Generator runtime (hours/day) |
Average number of hours per day that the generator is operating |
Generator O&M ($/day) |
Average operational costs of the generator |
Generator fuel consumption (L/day) |
Average fuel consumed by the generator per day |
Generator fuel cost ($/day) |
Average cost of the fuel consumed by the generator per day |
Battery throughput (kWh/day) |
Average kWh that the battery outputs per day |
Battery wear cost ($/day) |
Average wear cost for the battery per day |
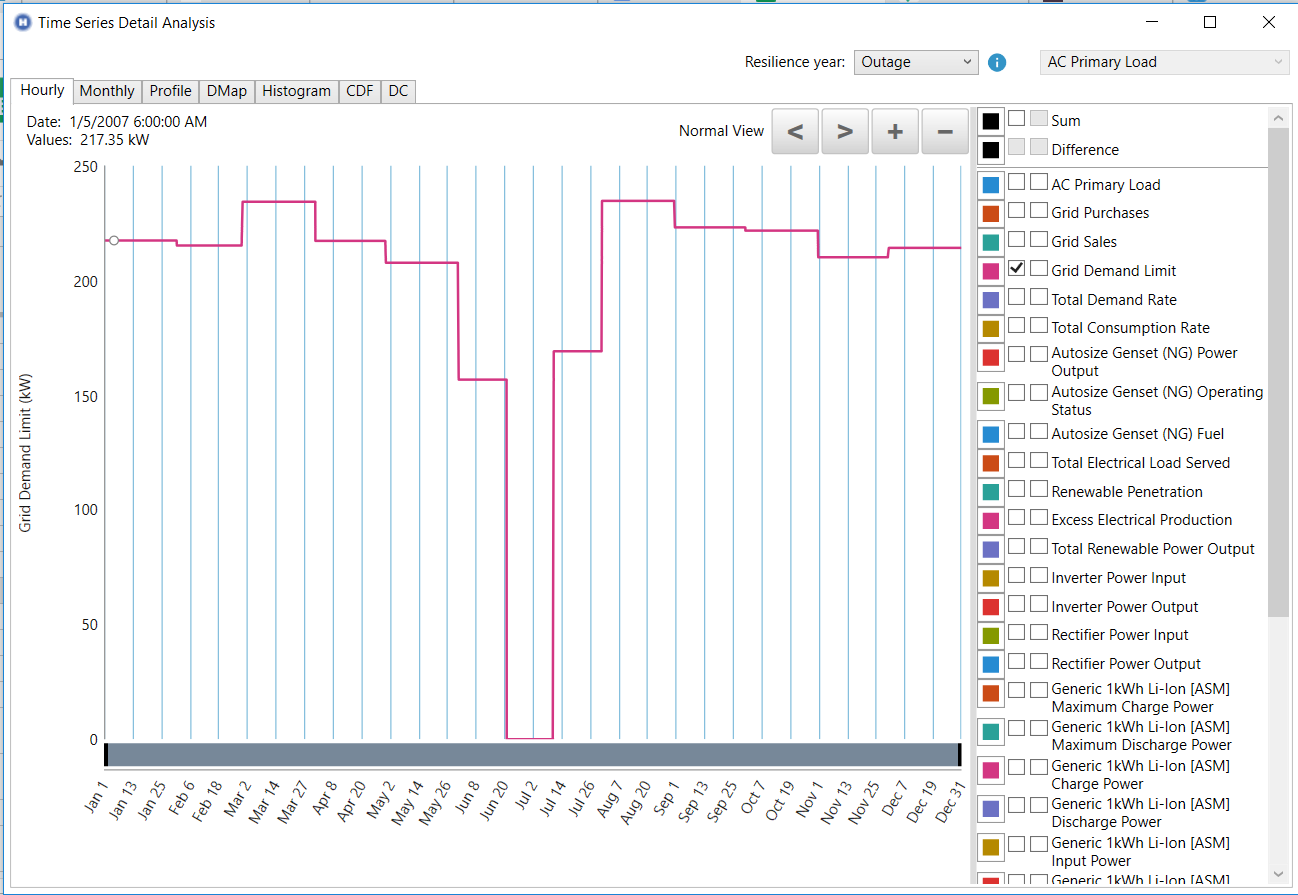
If you want to see the outage in time series analysis, then select "Grid Demand Limit". This limit would go to 0 during outages. Below is an example of a multi-day outage occurring June-July.

Tip: You can view any of the Simulation Results tabs in either “Outages” or “No Outages” mode. Select from the drop-down at the upper left-hand corner.
