
HOMER Pro 3.16

![]()
Important: This option is part of the Biomass module. See Adding Modules for more information on purchasing modules.
HOMER assumes the biomass feedstock is fed into a gasifier to create biogas. One or more generators then consume the biogas to produce electricity (and optionally heat). Use the Biomass Resource page to describe the availability of biomass feedstock. HOMER uses this data to calculate (in each time step of the year) the amount of biogas that can be supplied by the gasifier to the biogas-fueled generator(s).
Click the Biomass button under the Resources tab in the toolbar at the top of the page. The Biomass Resource page appears.
For each time step, HOMER decides how to operate the biomass generator(s). If there is not enough feedstock available, HOMER might not be able to run the generator at full power or turn the generator on at all. Other than this constraint, deciding how to run a biomass generator is similar to the logic used to control a normal generator.
Once HOMER decides the operating load for the biomass generator, the mass of biogas required is calculated from the fuel curve. The gasification ratio is used to convert the mass of biogas into a mass of biomass resource. This is the amount of biomass resource used (or purchased, if a price is assigned to the biomass feedstock) in the time step. If the available biomass feedstock is not all gasified and consumed in a given time step, the remainder is saved and can be used in future time steps.
Choose Biomass Data Source
The baseline data is a one-year time series representing the average biomass feedstock availability, expressed in kilograms, for each time step of the year. HOMER displays the monthly averages calculated from the baseline data in the Monthly Average Available Biomass Data table and graph.
There are two ways to create baseline data: you can use HOMER to synthesize hourly data from monthly averages, or you can import time series data from a file.
Click either the Enter monthly averages radio button or the Import from a time series data file or the library radio button.
Enter Monthly Averages
To synthesize data, you must enter twelve average values of biomass availability: one for each month of the year. Enter each month's average biomass availability (in tonnes per day) in the appropriate row of the table. As you enter values in the table, HOMER builds a set of 8,760 values, or one value for each hour of the year. HOMER creates the synthesized values by assuming that the biomass availability is constant throughout each month; HOMER assigns the monthly average value to each hour in that month.
Import Biomass Data
To import a file, you must prepare a text file that contains the biomass feedstock availability in each time step for a complete year.
Tip: You can import data with any time step down to one minute. HOMER detects the time step when you import the data file. For example, if the data file contains 8760 lines, HOMER assumes it contains hourly data. If the data file contains 52,560 lines, HOMER assumes it contains 10-minute data.
The data file must contain a single value on each line, corresponding to one time step. Each value in the file represents the biomass feedstock availability (in kilograms) for that time step. The first time step starts at midnight on January 1st. The following is a sample input file.
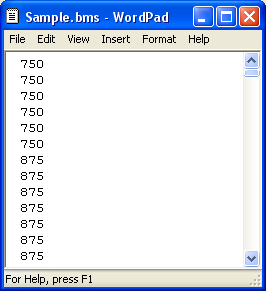
Click the Import button or the Import and Edit button to open the text file. You can import a text file with any extension.
When you import data from a text file, HOMER makes a copy of the data set and integrates it with the HOMER (.homer) file. After the data is part of the HOMER file, HOMER no longer refers to the original text file. If you modify data in the original file, you must import the modified file in order for the modification to be included in the HOMER file. After you import a data file, HOMER calculates twelve monthly average biomass availability values and displays them in the table and graph. HOMER also displays the name of the imported data file in the title of the biomass resource graph.
If you click the Enter monthly averages radio button after importing data from a file, HOMER discards the data from the imported file and synthesizes new data based on the twelve monthly average values it calculated from the imported data. You can edit synthesized data by changing values in the biomass resource table. To edit values from an imported file, you must edit the file directly and then import the modified file, as described above.
Properties
Variable |
Description |
Average price ($/t) |
The average cost per tonne of the biomass feedstock |
Carbon content (%) |
The carbon content of the biomass feedstock as a mass-based percentage |
Gasification ratio (kg/kg) |
The ratio of biogas generated to biomass feedstock consumed in the gasifier |
LHV of biogas (MJ/kg) |
The energy content (lower heating value) of the biogas produced by the gasifier |
Scaled data for simulation
HOMER uses scaled data for calculations. To create scaled data, HOMER multiplies each of the baseline data values by a common factor that results in an annual average value equal to the value that you specify in the Scaled Annual Average box.
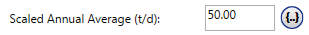
To determine the value of this factor, HOMER divides the Scaled Annual Average by the baseline annual average. The scaled data retains the shape and statistical characteristics of the baseline data, but may differ in magnitude. The default value for the Scaled Annual Average is the baseline annual average. When the two values are equal, the scaled data and baseline are identical. HOMER interprets a Scaled Annual Average of zero to mean that there is no biomass resource.
Two reasons to use a different Scaled Annual Average than the baseline annual average are for unit conversion and sensitivity analysis.
The Plot button allows you to view the scaled data in several graphical formats.
Note: To the right of each numerical input is a sensitivity button ( ) that allows you to do a sensitivity analysis on that variable. For more information, see Why would I want to do a sensitivity analysis?
See also
